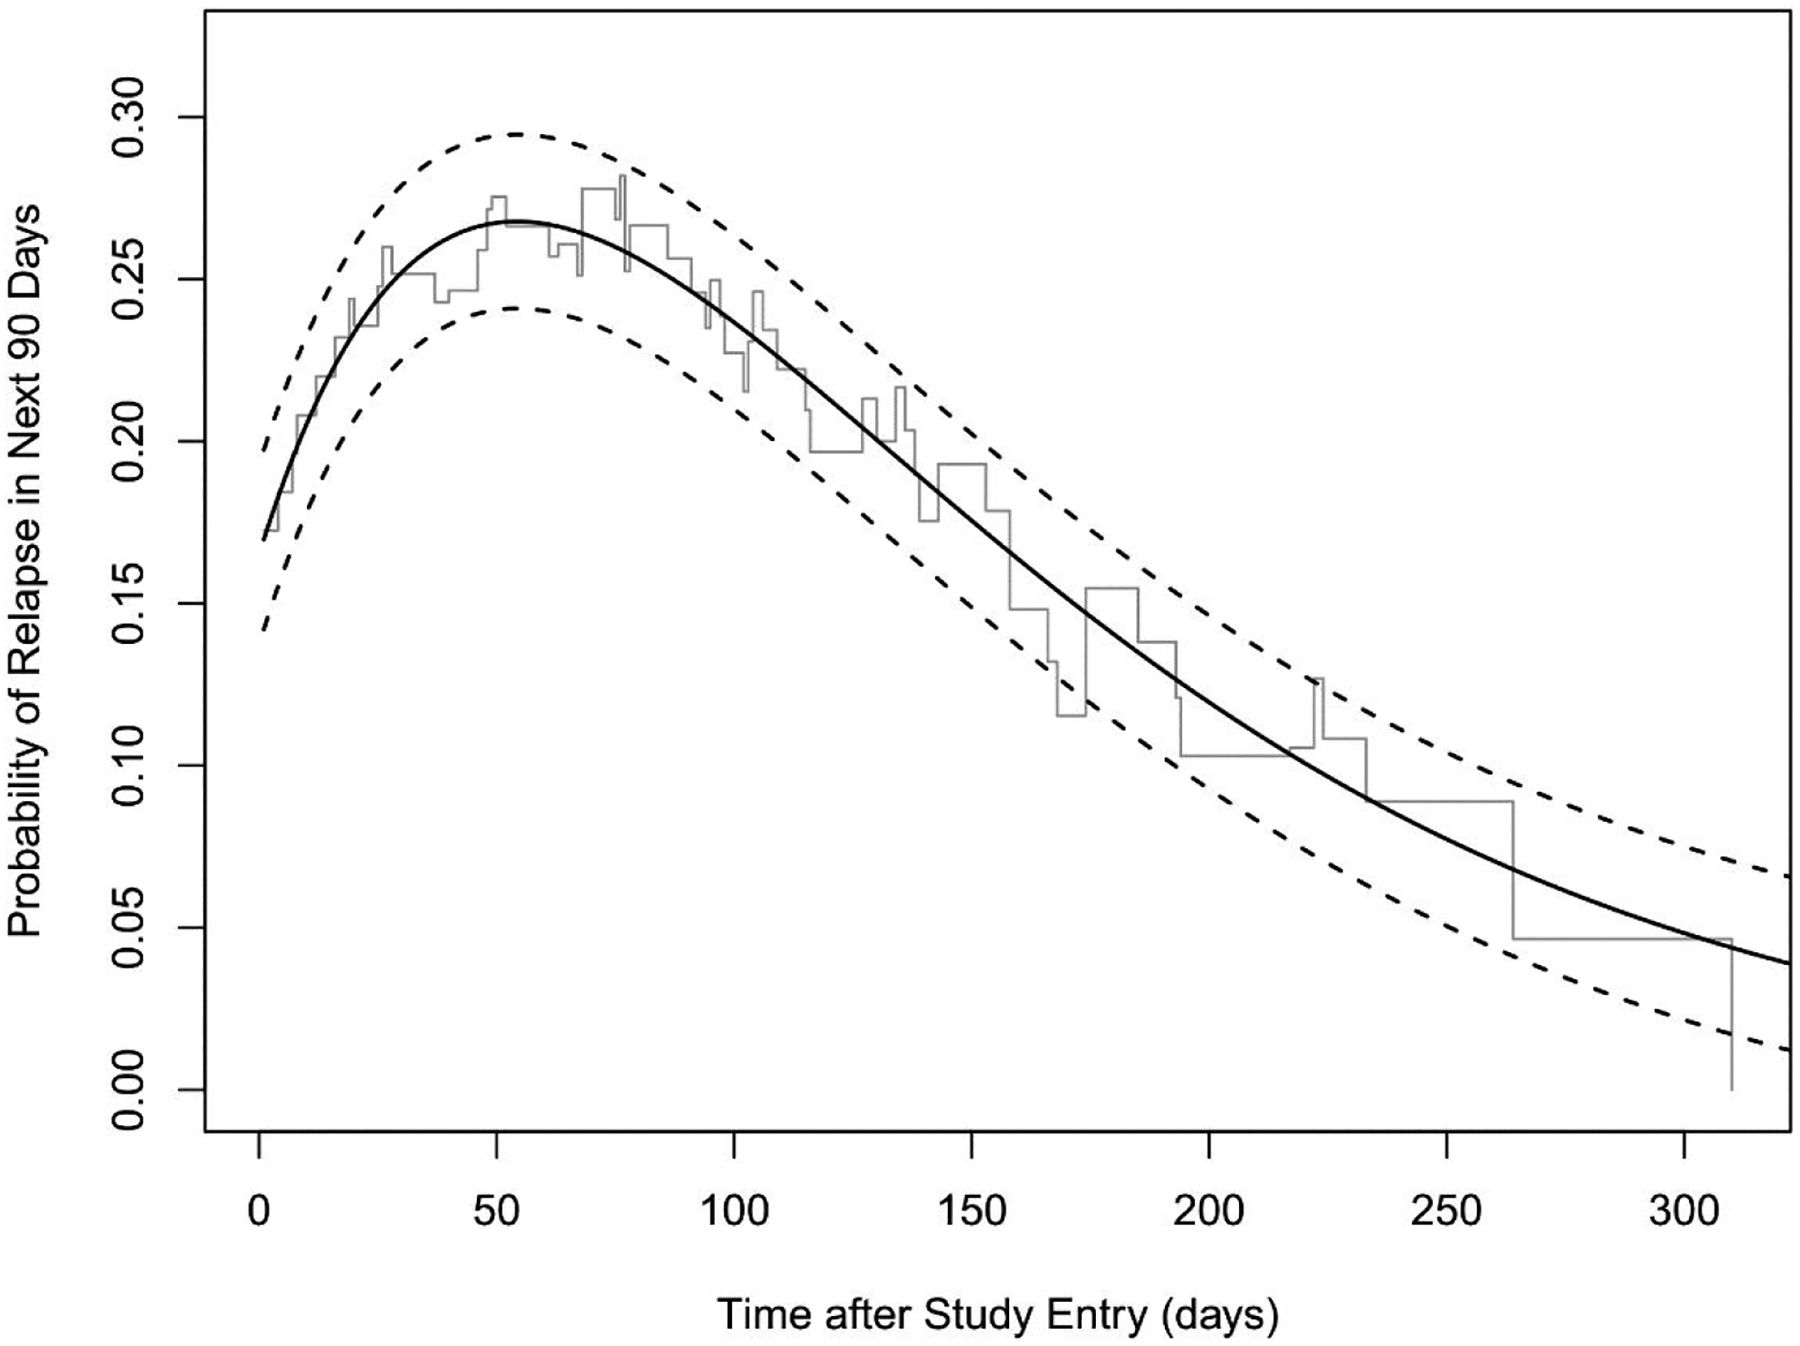
Figure 2.

Probability of relapse in the next 90 days versus time after study entry.
The line in grey is the step function showing the nonparametric Kaplan Meier estimator. The fitted gamma function is shown by the black line; the dashed lines show the 95% confidence intervals. The fitted parameters are (95% CI: −0.0130, −0.0125), (95% CI: 0.0090, 0.0095), and (95% CI: −26.36, −22.13). At day 0, the probability of relapse within next 90 days was 17.0% ± 1.5%. The maximum risk of relapse was on day 54 when the probability was 26.8% ± 1.4%. After day 297, the relapse risk declined to below 5%.
