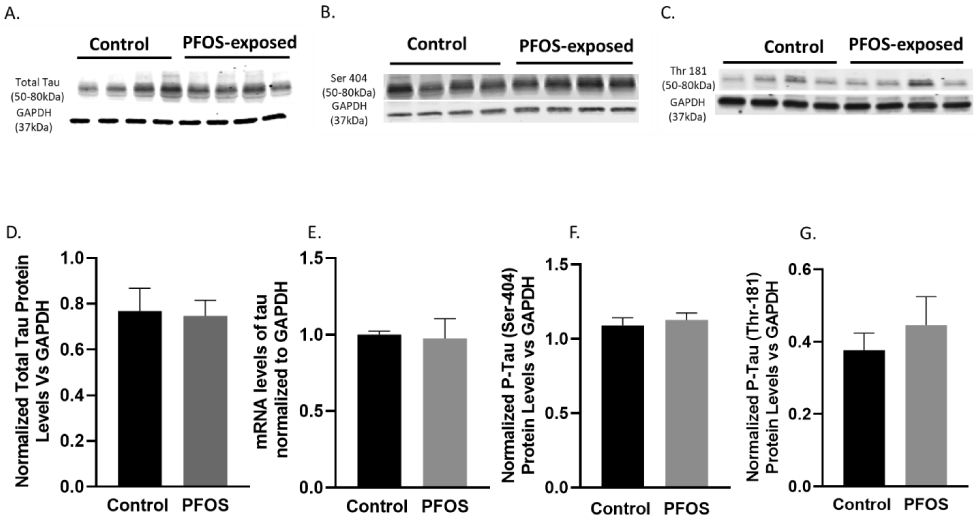
Figure 5. Tau mRNA and protein levels at PND 20 in the cortex of CD-1 pup mice developmentally exposed to PFOS (tau pathway).

Timed-pregnant CD-1 mice were administered with vehicle (0.5% Tween-20 in water) or 1 mg/kg/day PFOS in water with 0.5% Tween-20 via oral gavage from gestation GD1 through postnatal day PND 20. (A D) Blots and quantification of Tau protein levels normalized to GAPDH. (E) Tau mRNA levels. (B, F) Blots and quantification of p-tau (ser404) protein levels normalized to GAPDH. (C, G) Blots and quantification of p-tau (Thr 181) protein levels normalized to GAPDH. Results are expressed as mean ± S.E.M using the two-tailed unpaired t-test, n=4. Results don’t indicate a significant difference between the two groups.
