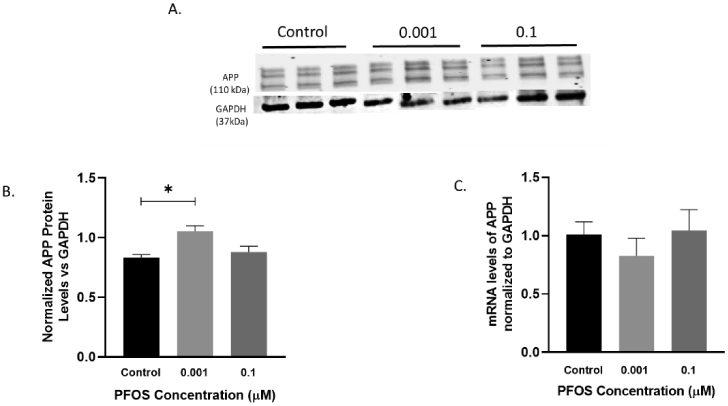
Figure 9. APP mRNA and protein levels in differentiated SH-SY5Y cells after PFOS exposure (amyloidogenic pathway).

Differentiated SH-SY5Y cells exposed to PFOS at 0.001 and 0.1 μM concentrations for 24 h. (A-B) Blots and quantification of APP protein levels normalized to GAPDH. (C) APP mRNA levels. Results are expressed as mean ± S.E.M using the one-way ANOVA followed by Dunnett’s for multiple comparisons, n=3 per treatment group (*P<0.05, **P< 0.01).
