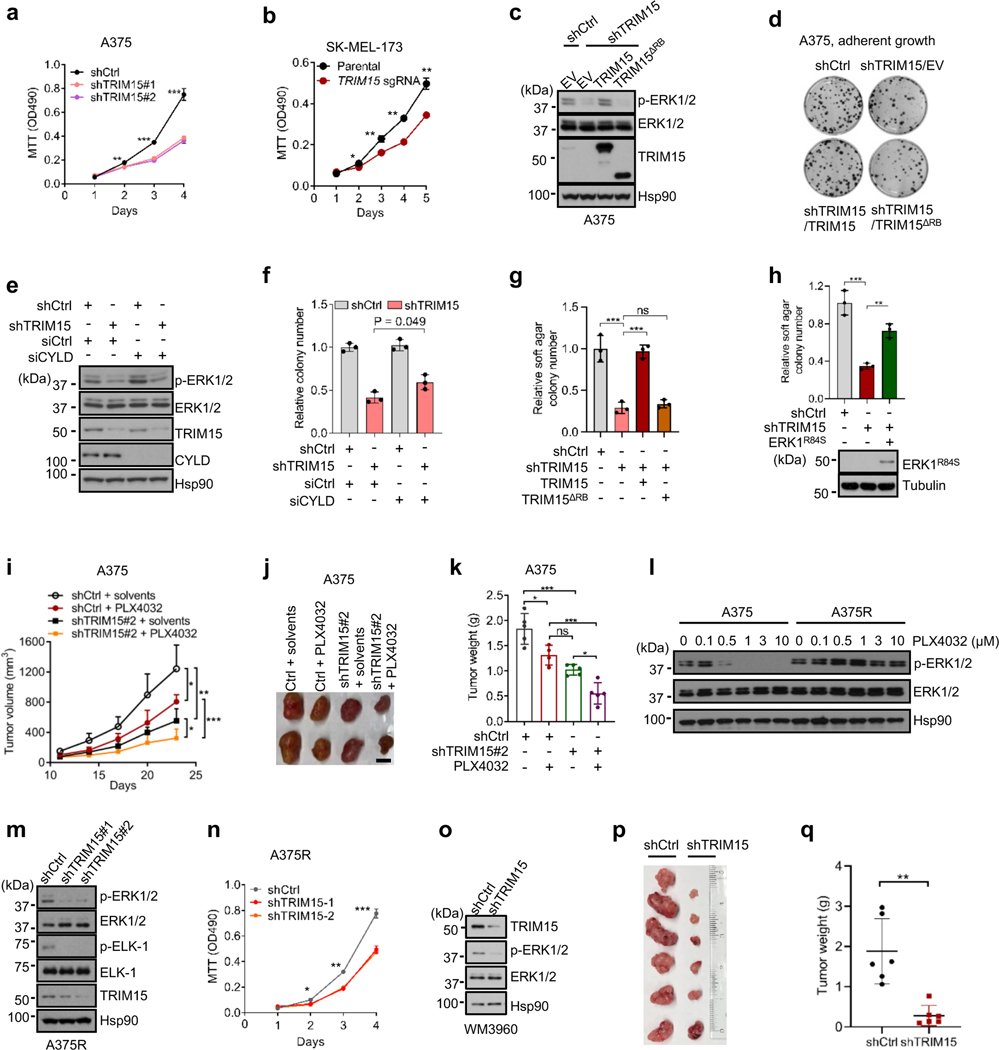
Fig. 7 |. An oncogenic role for TRIM15 in melanoma.
a, Proliferation of A375 cells transduced with lentiviral vectors expressing control shRNA (shCtrl), TRIM15 shRNAs #1, or TRIM15 shRNAs #2.
b, Proliferation of parental and TRIM15-knockout SK-MEL-173 cells.
c, d, g, A375 cells stably expressing shCtrl or shTRIM15 were transfected with or without TRIM15 or TRIM15ΔRB. Cells were analyzed for ERK1/2 activation (c), colony formation (d) and soft agar colony formation (g).
e, f, TRIM15-knockdown A375 cells transfected with siCtrl or siCYLD were analyzed for protein expression (e) and colony formation (f).
h, Soft agar colony formation by SK-MEL-28 cells stably expressing control shRNA, TRIM15 shRNA, and Flag-ERK1R84S as indicated. ** P = 0.005; *** P = 0.0002.
i-k, Xenograft tumor formation by control and TRIM15-knockdown A375 cells in mice that were treated with or without PLX4032. Shown are tumor volume over time (i), and representative tumor images (j) and tumor weight (n = 5 animals) (k) at day 23.
l, Re-activation of ERK1/2 in PLX4032-resistant A375 (A375R) cells. A375 and A375R cells treated with increasing concentrations of PLX4032 for 24 h were analyzed for ERK1/2 activation by Western blot.
m, n, A375R cells were transduced with lentiviral vectors expressing control or one of the two independent TRIM15 shRNAs. Cells were analyzed for ERK1/2 and ELK-1 phosphorylation (m) and proliferation (n).o-q, Melanoma PDX-derived cell line WM3960 stably expressing control (shCtrl) or TRIM15 (shTRIM15) shRNAs were analyzed for protein expression (o) and tumor formation in xenografted mice with tumor images (p) and weights shown (q) (n = 6 biologically independent animals), ** P = 0.0037.
Assays in panels c, e, l, m, and o have been performed two times with similar results. Data are Mean ± SD (n = 4 biologically independent samples for a, and 3 for b, f-h, and n). * P < 0.05; ** P < 0.01; *** P < 0.001; ns, no significance. Two-tailed Student’s t-test for a, b, n, q; one-way ANOVA test followed by Tukey’s post hoc test for g-i, k.

