
Figure 3. Neonatal outcomes after betamethasone treatment of HMGB1-injected dams.
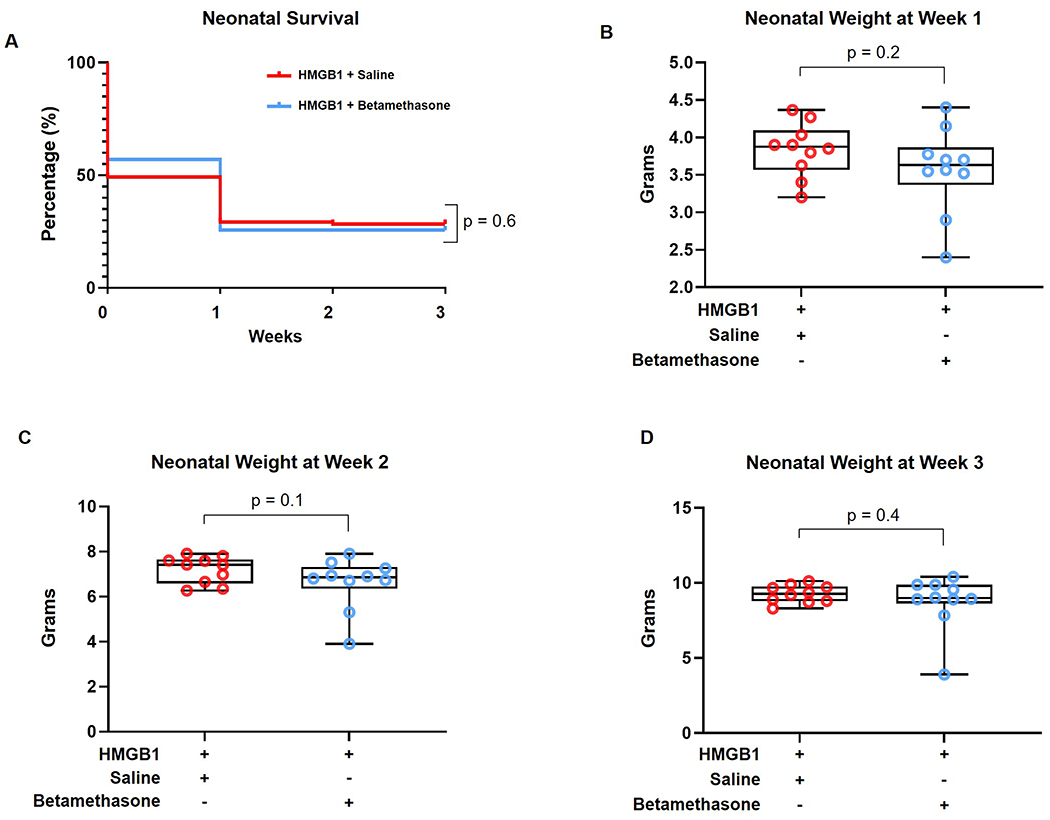
(A) Kaplan-Meier survival curves representing neonatal survival at weeks 1, 2, and 3 postpartum for neonates from dams injected with HMGB1 and treated with vehicle (saline, red line) or betamethasone (blue line) (n = 116 - 120 per group). (B-D) Weights of neonates from dams that received HMGB1 and were treated with vehicle (saline, red dots) or betamethasone (blue dots) at weeks 1 (B), 2 (C), and 3 (D) postpartum (n = 10 litters each). Data are shown as boxplots where the midline represents the median, boxes represent interquartile range, and whiskers represent the minimum/maximum range. Each dot corresponds to the mean weight of all neonates from a single dam (litter).