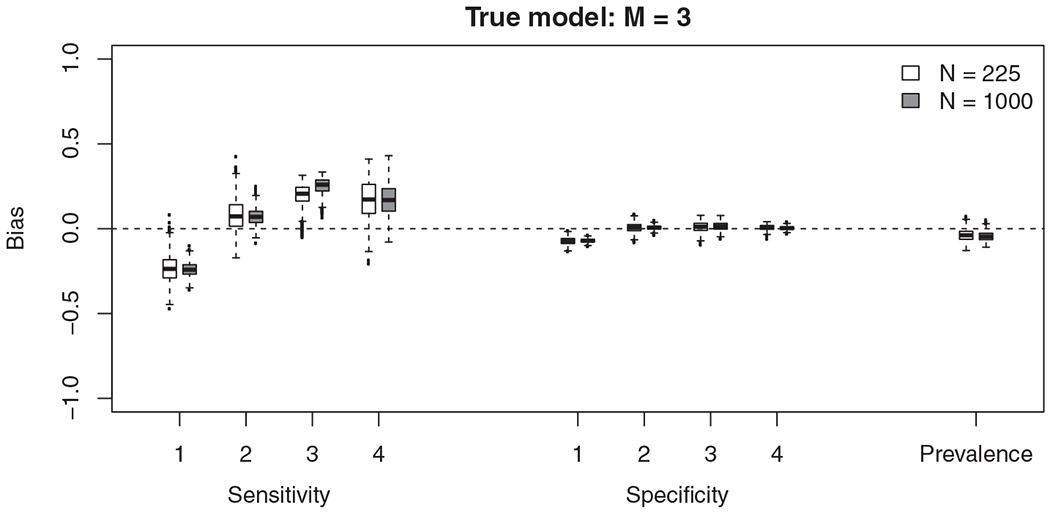
FIGURE 4.

The difference between the true sensitivity/specificity and estimated sensitivity/specificity of the 1000 simulations when the true model has three-states (M = 3). We assess the sensitivity of the test to diagnose any disease (either state 1 or state 3)
