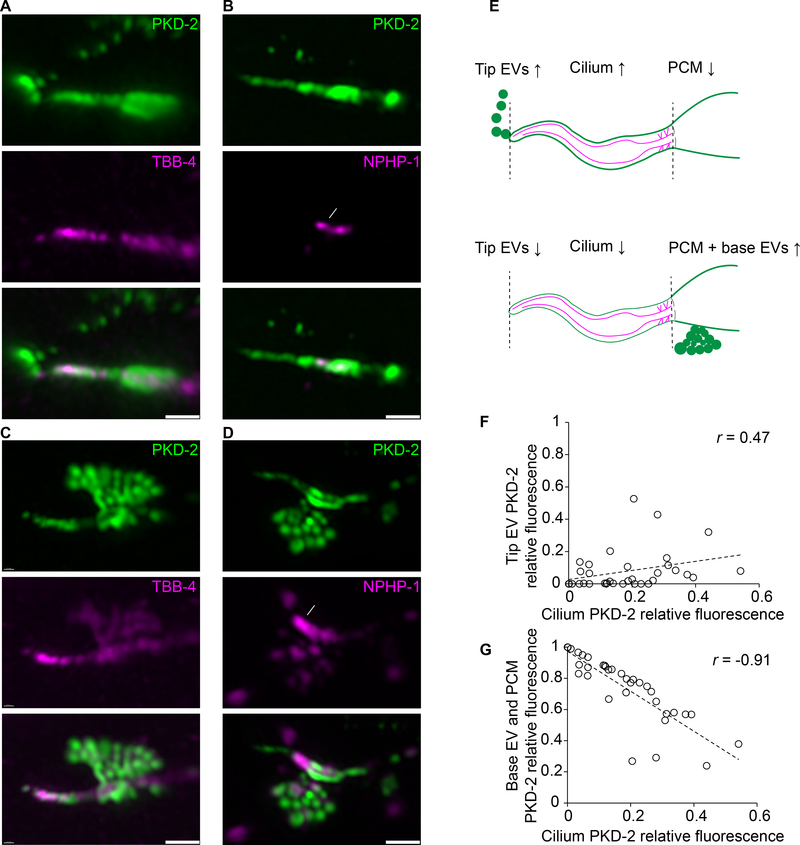
Figure 1: PKD-2 EVs are shed at two sites: the ciliary tip and base of the cephalic male CEM cilium.
A-D PKD-2:GFP EVs captured at the moment of shedding from the tip (in A and B) or from the base (in C and D) of the CEM cilium. The axoneme is labeled with β-tubulin TBB-4::tdTomato, transition zone is labeled with NPHP-1::dsRed. White arrowheads indicate environmental EVs outside the animal, white arrows point to the transition zone. Dashed white lines outline base EVs in the process of shedding, solid white lines indicate PCM, periciliary membrane this is situated below the transition zone.
E, Schematic cartoon showing the relationship between PKD-2 levels in ciliary tip EVs, the ciliary membrane and the region containing the PCM and ciliary base EVs.
F-G, Correlation plots showing that fluorescence intensity of the tip PKD-2::GFP EVs positively correlates with that of the ciliary shaft (F), whereas fluorescence intensity of the base PKD-2::GFP EVs inversely correlates with the presence of PKD-2::GFP at the ciliary shaft (G). Spearman test, 35 data pairs. r = 0.47, p = 0.004 for (f), r = − 0.91, p < 0.0001 for (G). Each circle indicates relative fluorescence intensity of the compartment, i. e. the environmental EVs, the ciliary shaft or the ciliary base for each cilium.
Scale bars are 1 μm.

