
Figure 1.
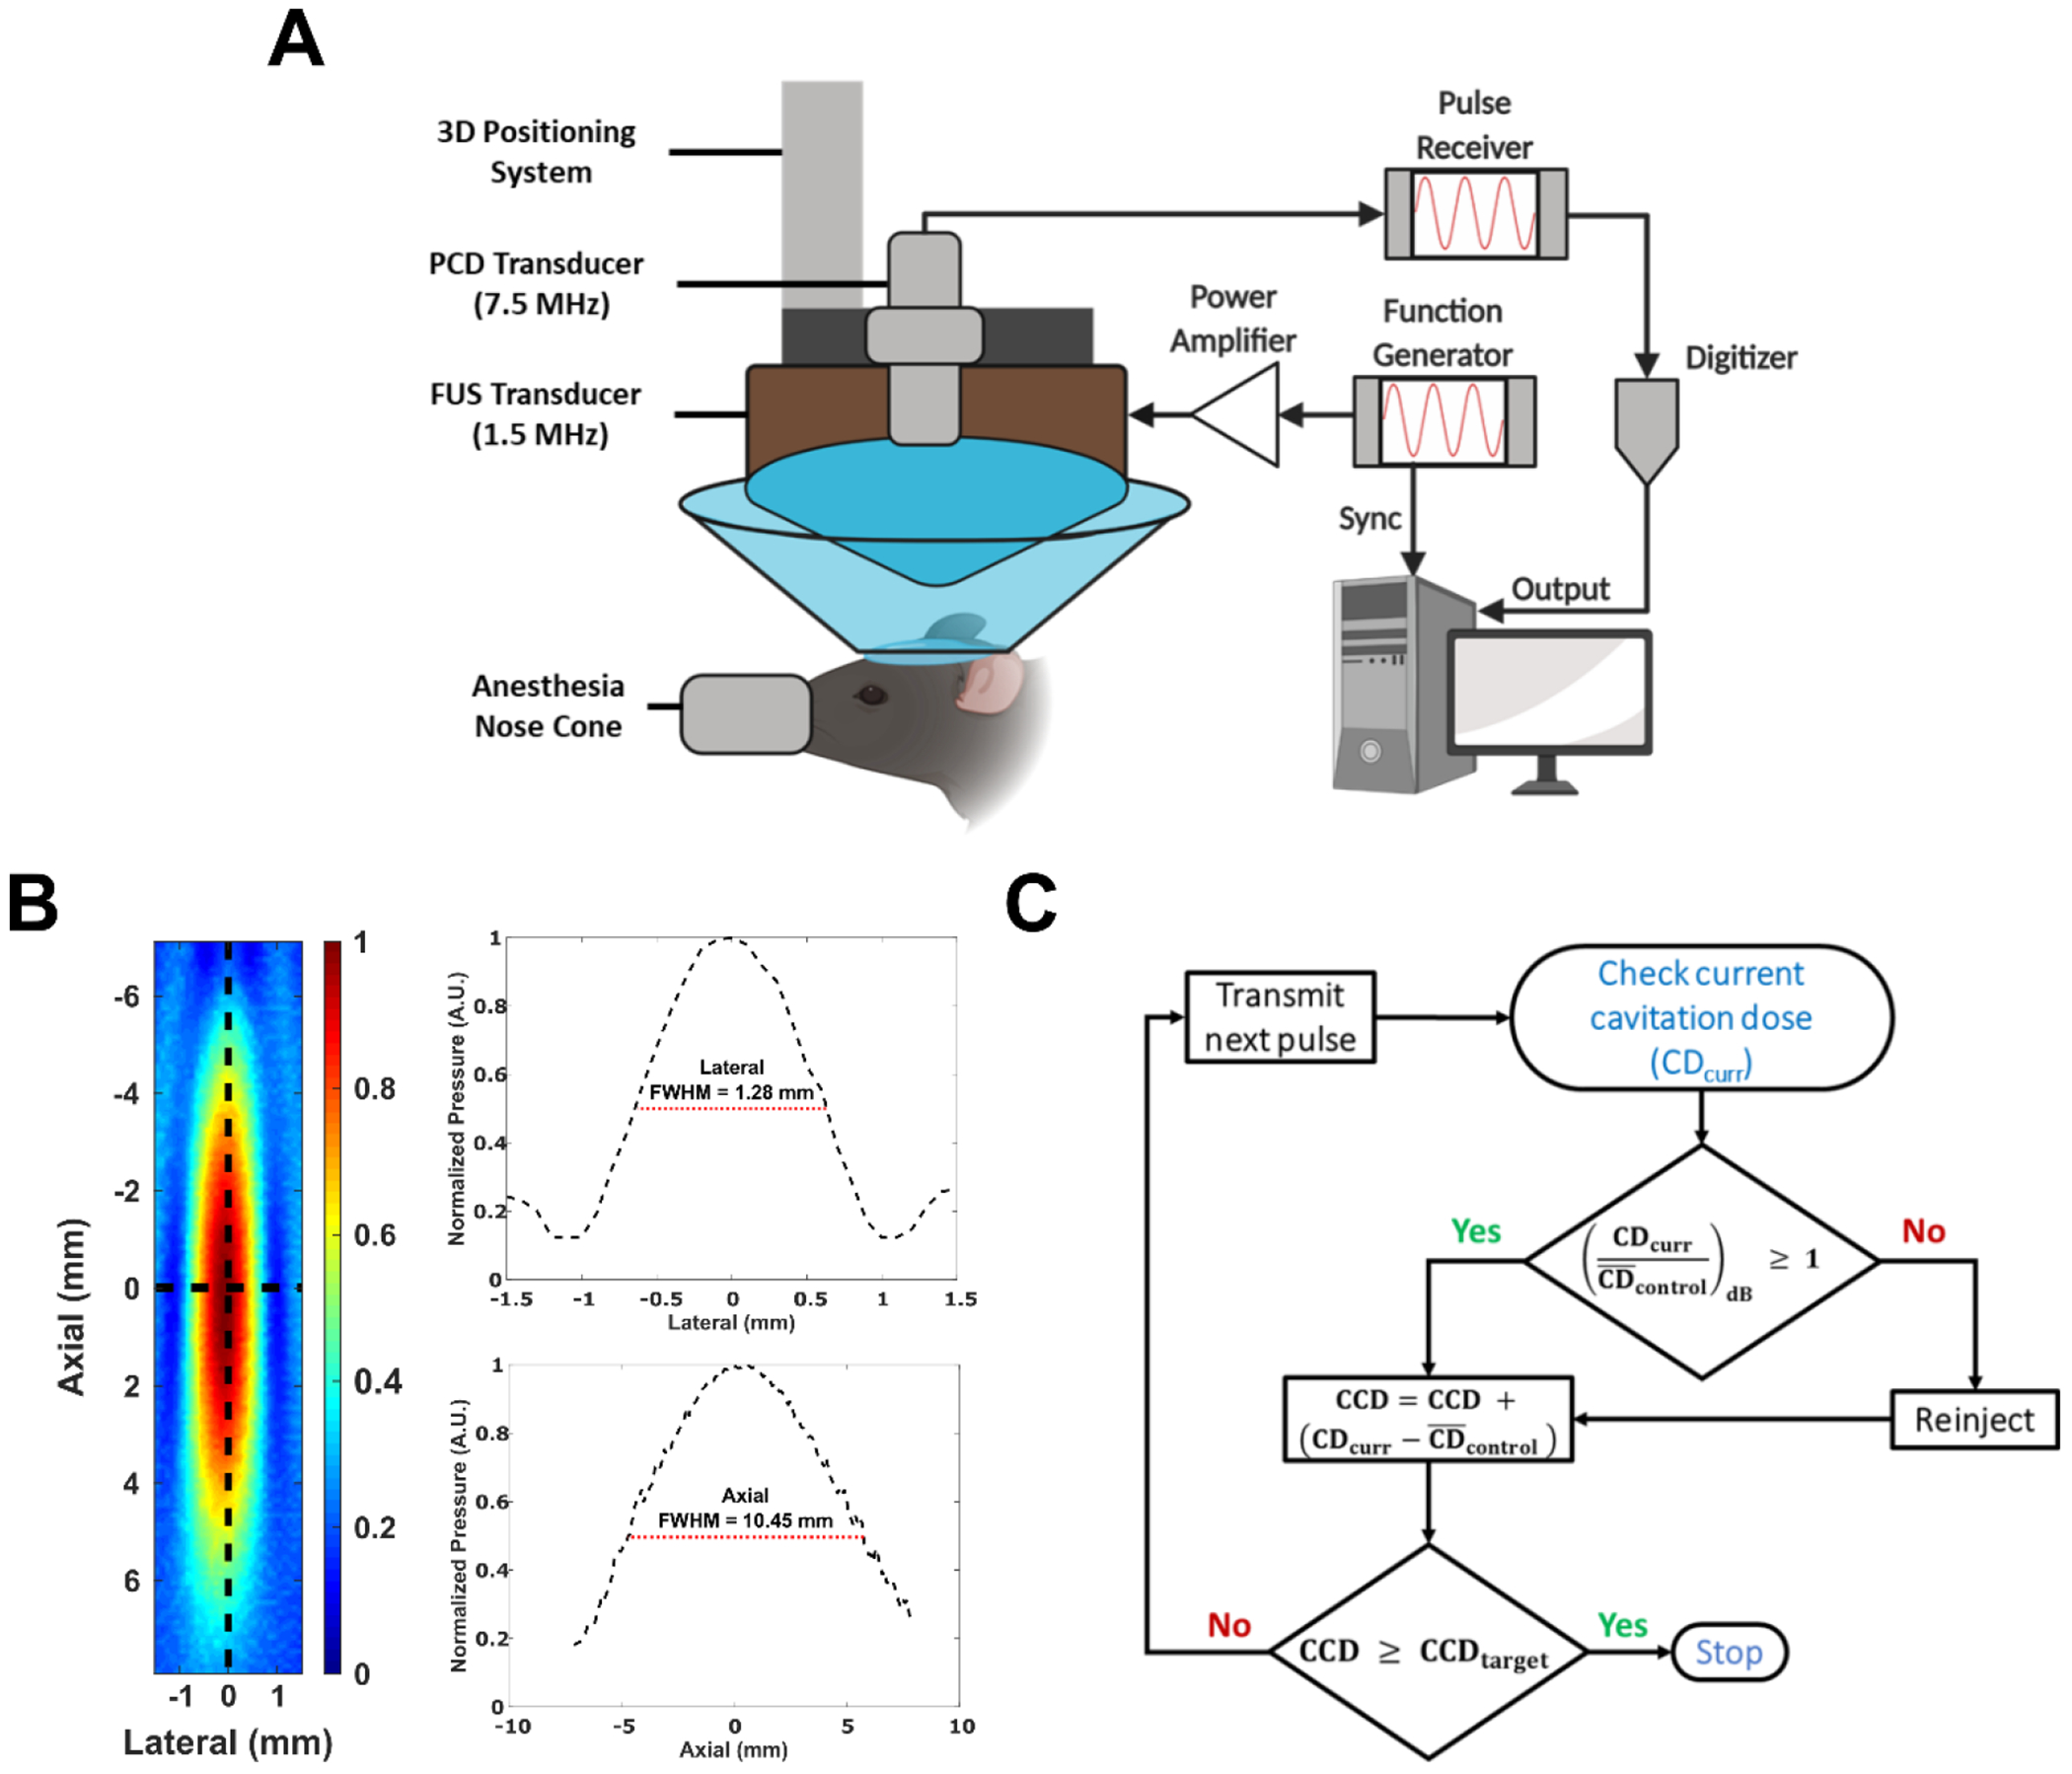
A) Schematic of the experimental setup used throughout this study (Created with Biorender.com). B) 2D axial pressure map of the 1.5 MHz FUS transducer measured with a bullet hydrophone in degassed water. Plots to the right of profile are lateral (top) and axial (bottom) 1-D plots taken along at the center along each respective axis. The full-width half max (FWHM) for each axis is shown. C) Block diagram of cavitation based-controller system used throughout this study.