
Figure 2.
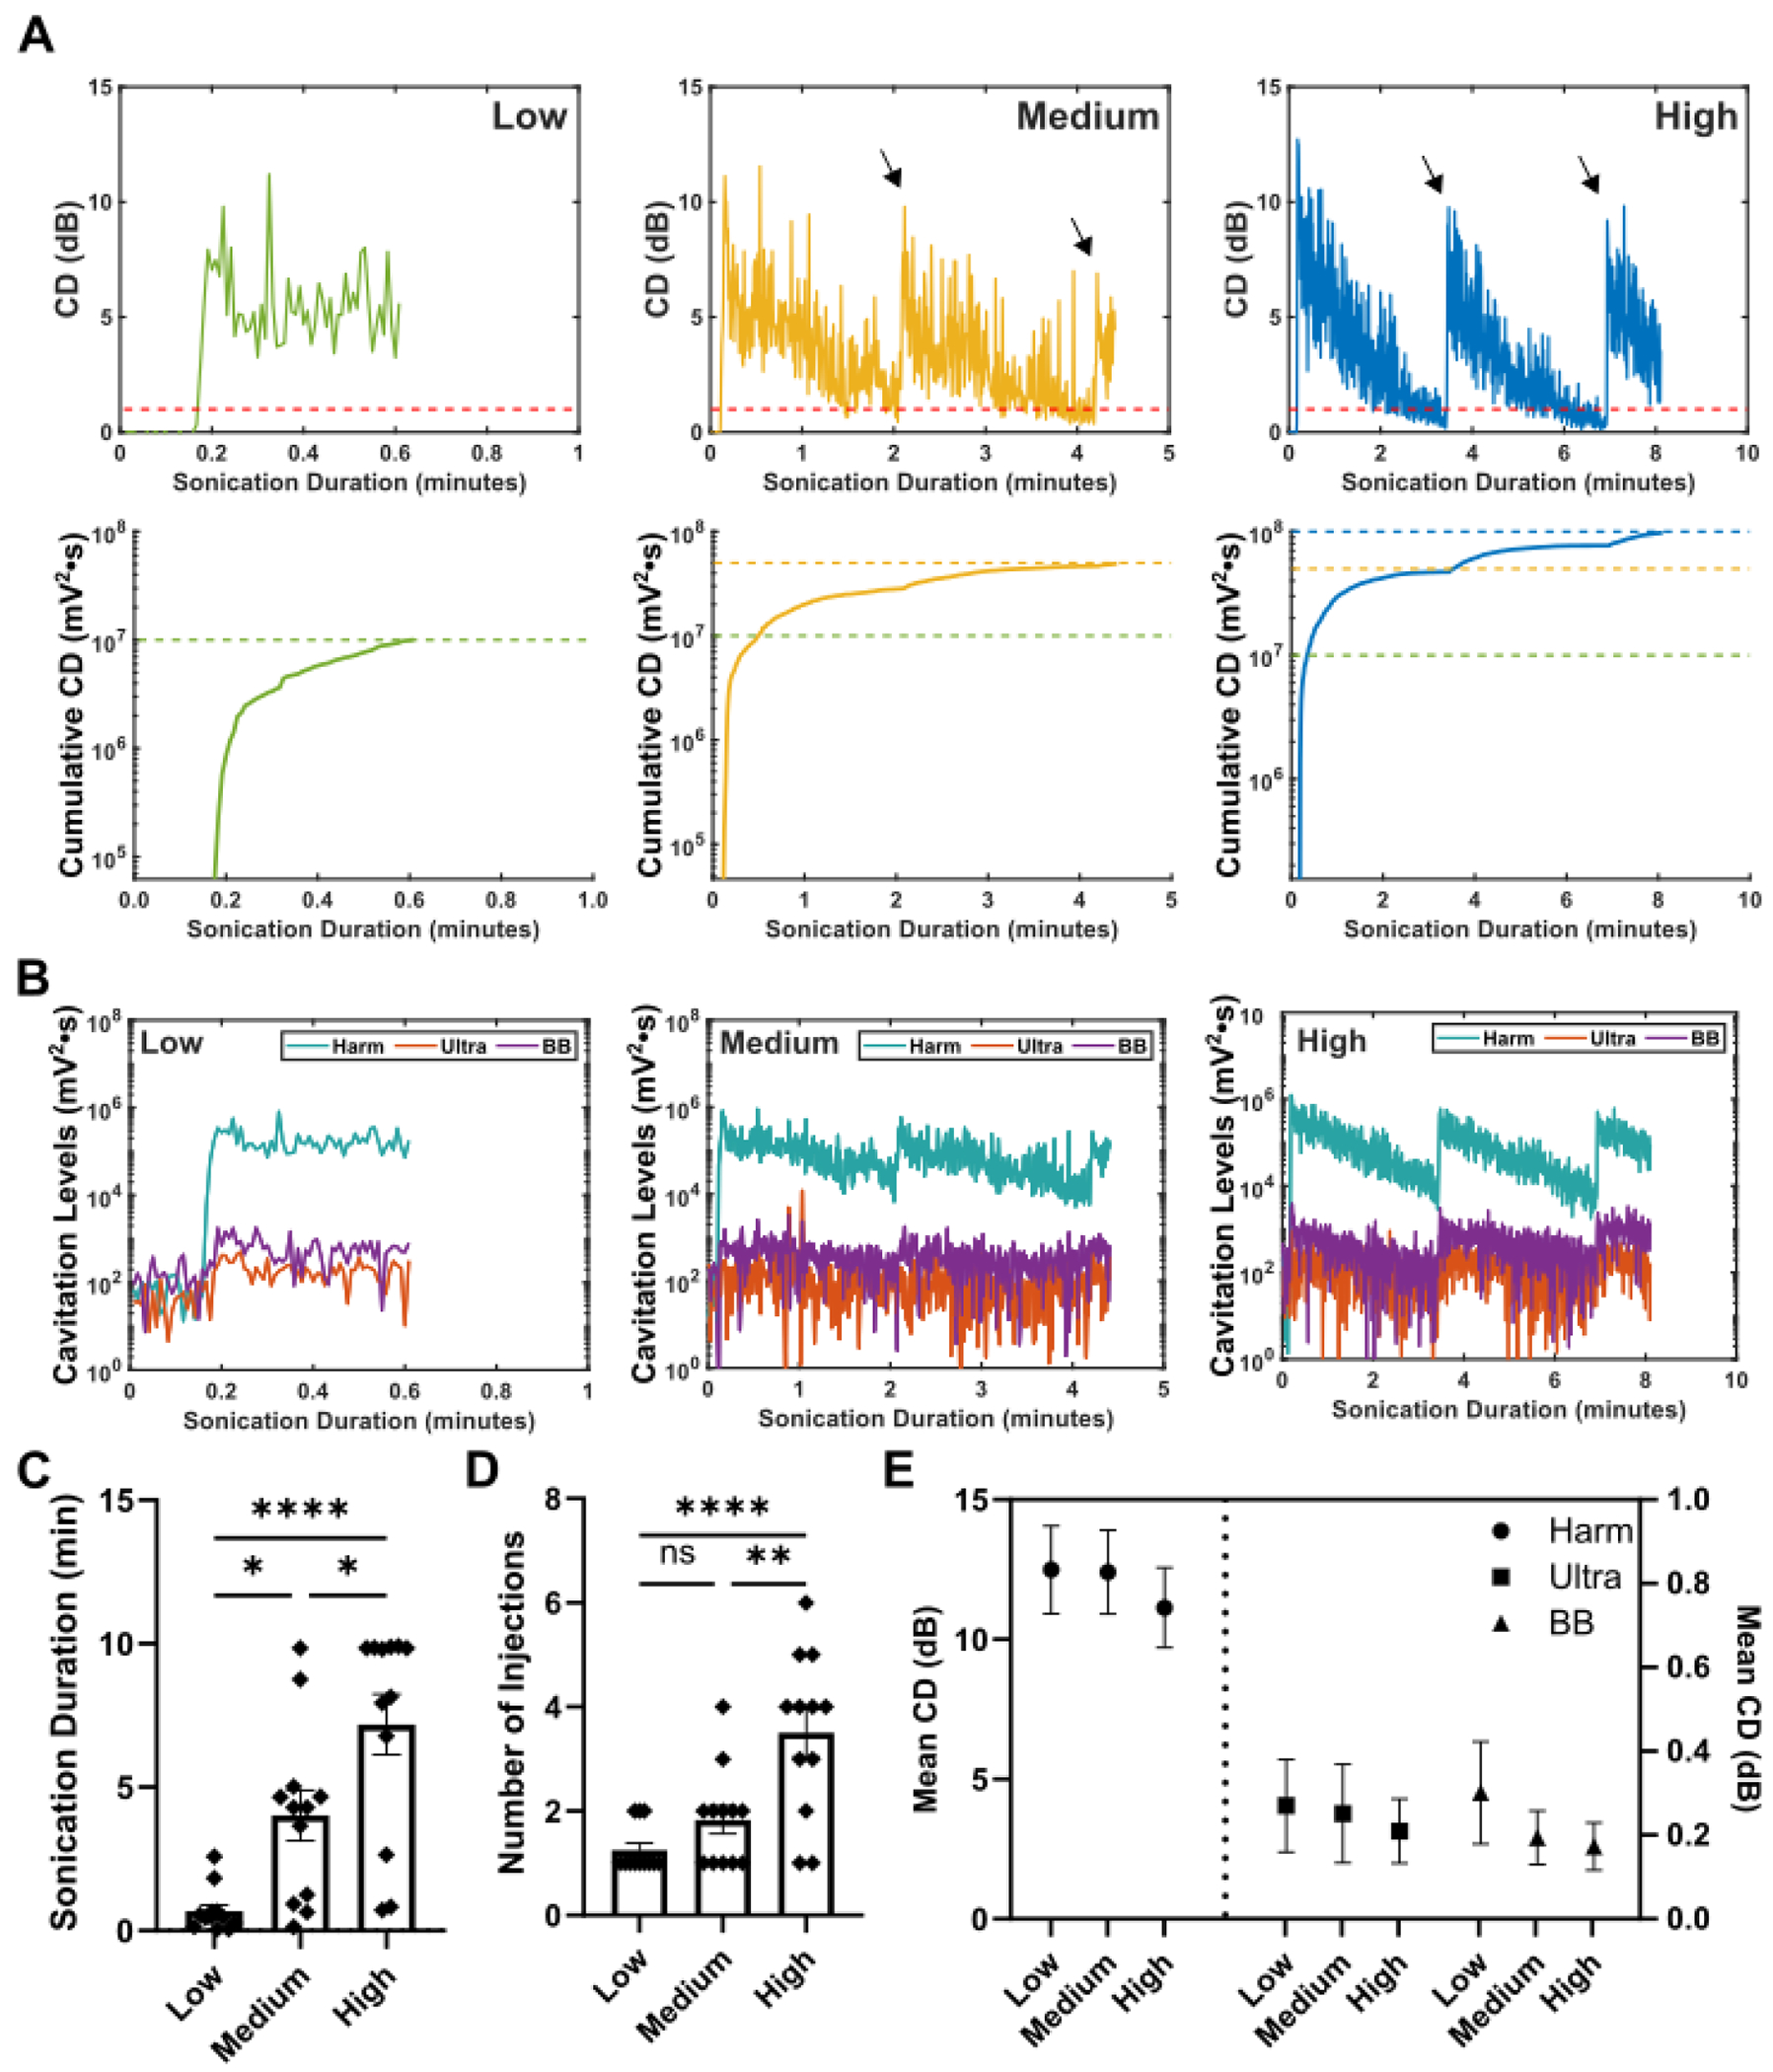
Cavitation Controller Results. A) Representative normalized CD plots (top row) and cumulative CD plots (bottom row) generated in real-time during sonications for CCDtargets of low (green, left column), medium (yellow, middle column), and high (blue, right column). Arrows in the normalized CD plots for the medium and high CCDtargets indicate points of microbubble reinjection. The dashed red lines represent the 1dB CD level for when microbubbles would be reinjected and the dashed colored lines correspond to the respective CCDtargets. Plots are normalized to the average CCD measured during the control (no microbubbles). B) Cavitation levels broken down into harmonic (harm), ultraharmonic (ultra), and broadband (BB) for the three CCDtargets. The spike in harmonic CD at the beginning is when microbubbles are injected. Summary of the C) sonication duration (low: 0.68 ± 0.22 min, medium: 4.0 ± 0.89 min, high: 7.2 ± 1.1 min) and D) number of injections (low: 1.3 ± 0.13 injections, medium: 1.8 ± 0.27 injections, high: 3.5 ± 0.45 injections) for the three different CCDtargets (One-way ANOVA with Tukey’s post-hoc multiple comparisons) E) Breakdown of the CD data into harmonic, ultraharmonic, and broadband (BB) doses. The mean CD over the whole sonication duration are reported for all three CCDtargets. N = 12 mice for each CCDtargets group was used. All error bars represent SEM. * - p < 0.05, ** - p < 0.01, **** - p< 0.0001, ns – not significant (p > 0.05).