
Figure 5.
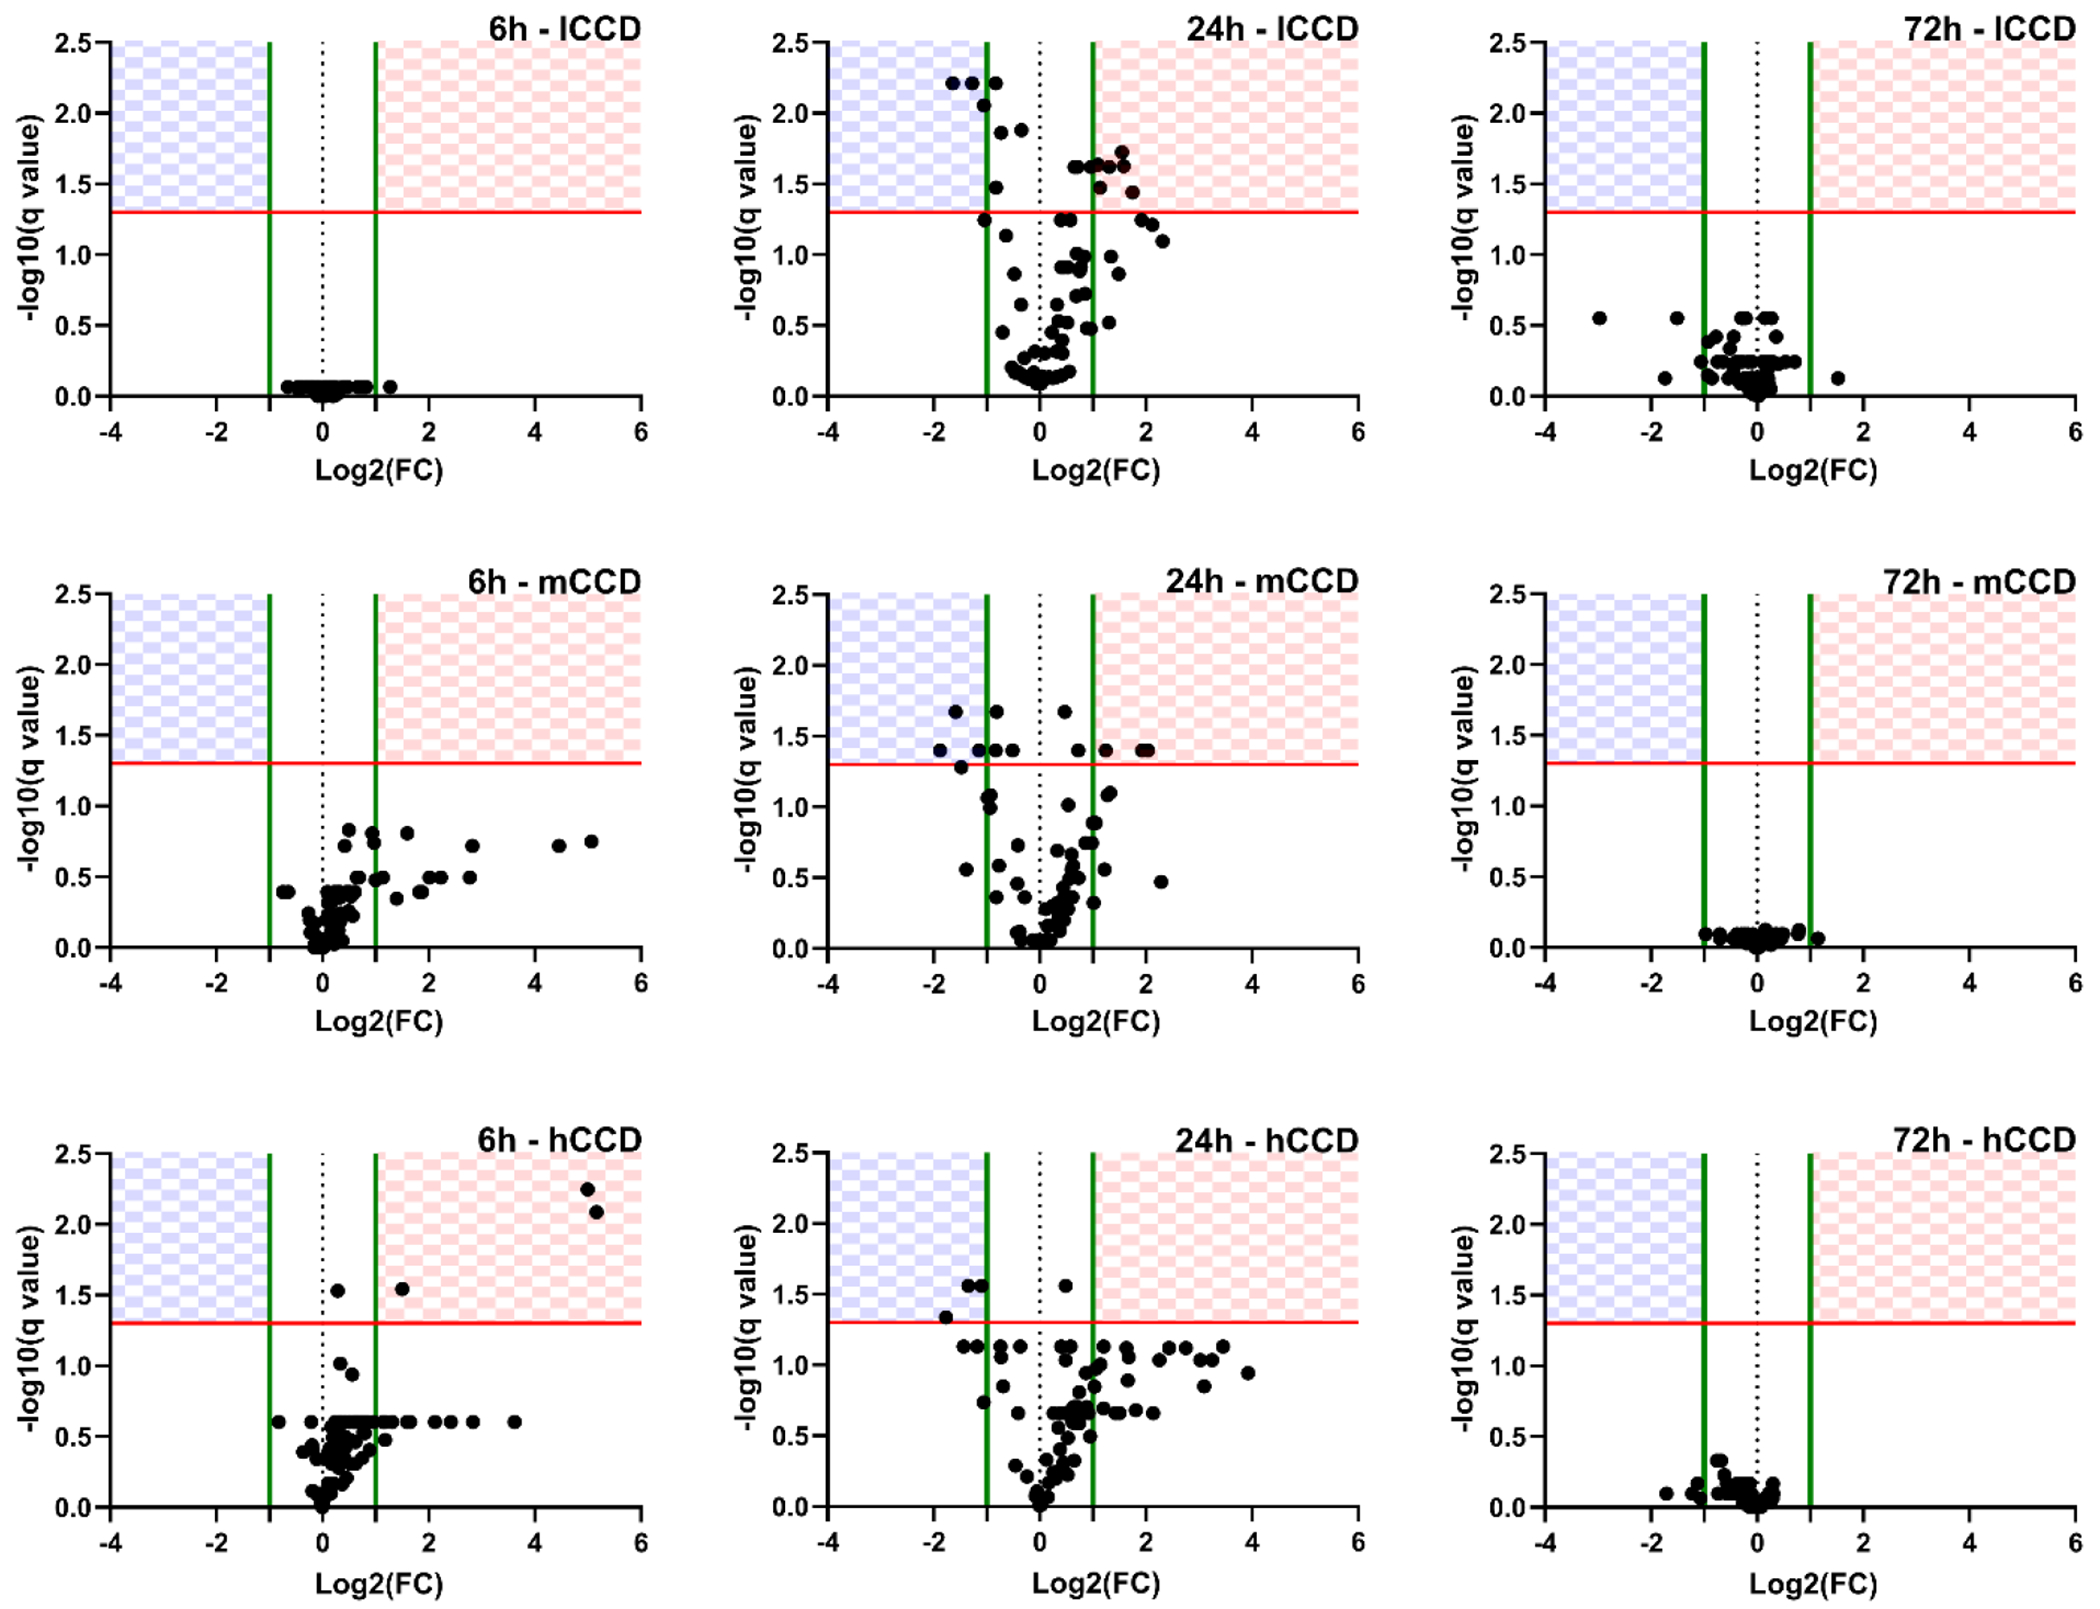
Volcano Plots of Gene Expression Changes. Relative gene expression is expressed as log2 of the fold change relative to the contralateral side. Each row represents data from low, medium, or high CCD (lCCD, mCCD, hCCD) groups while each column is a different time point (6 h, 24 h, 72 h). The checkered regions represent statistically significant changes in gene expression (q < 0.05, red line) and have a log2 fold change greater than 1 for upregulation, and less than −1 for downregulation (green lines). Genes in the top left quadrant (checkered blue) represent genes significantly downregulated and genes in the top right quadrant (checkered red) represent genes significantly upregulated. N = 4 per plot.