
Figure 6.
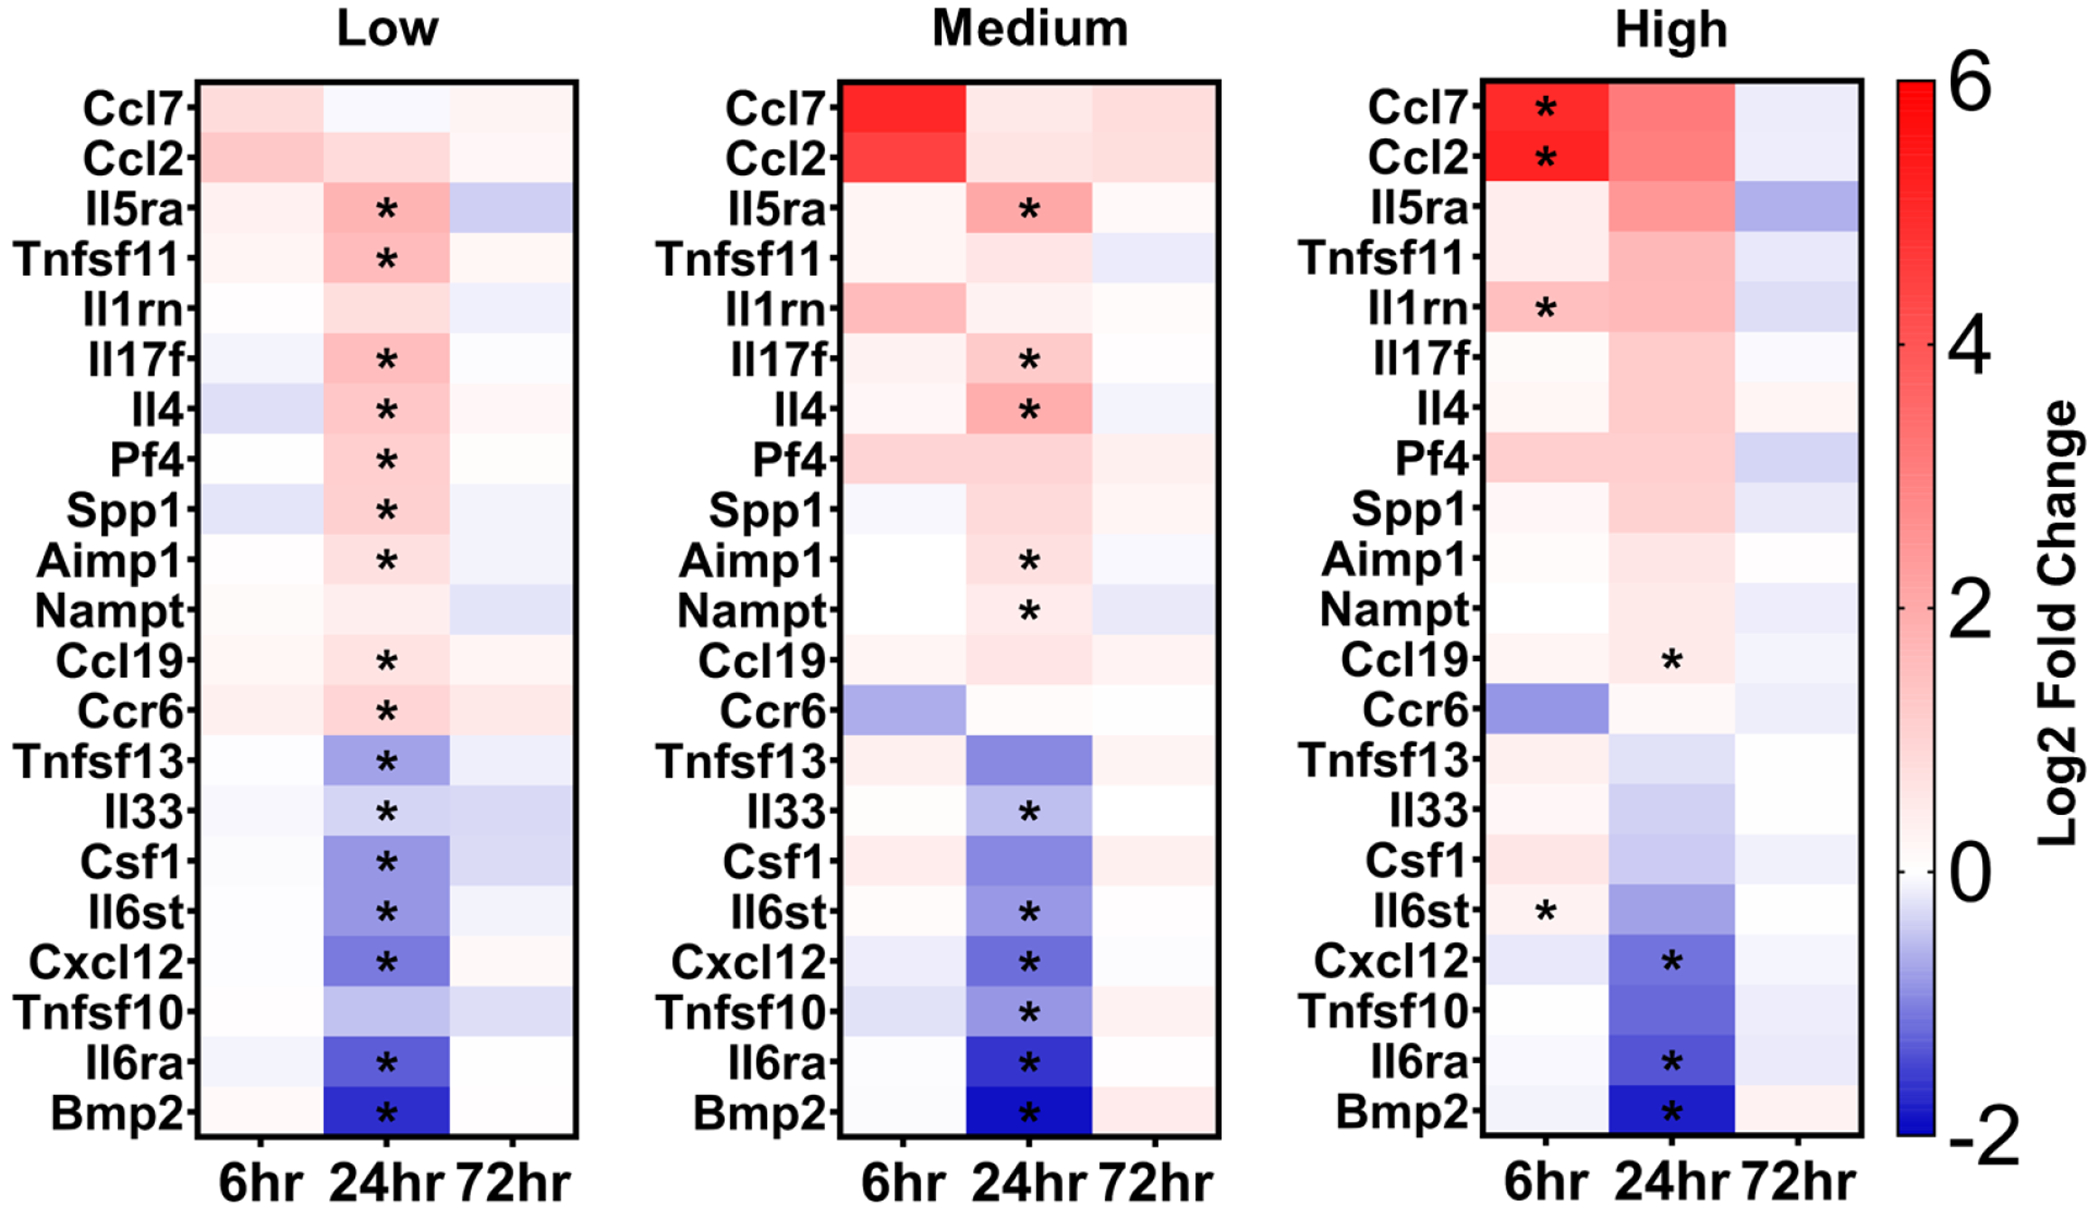
Heat maps of relevant genes with changes in expression levels relative to the non-sonicated contralateral striatum. Each heat map is grouped by the CCD groups (low, medium high) and within each group, the 3 time points (6 h, 24 h, 72 h) are shown. Genes with statistically significant changes and biologically relevant changes (|log2FC| > 1) at any time point or in any group are included. Genes marked with an asterisk signify statistically significant log2 fold change. Genes with positive log2 fold changes were considered upregulated and genes with negative fold2 changes were considered downregulated. Statistically significant changes in gene expression were assessed using paired sampled t-test with FDR multiple comparison correction (q < 0.05). Each point in the heat map is the arithmetic mean log2 fold change of 4 mice.