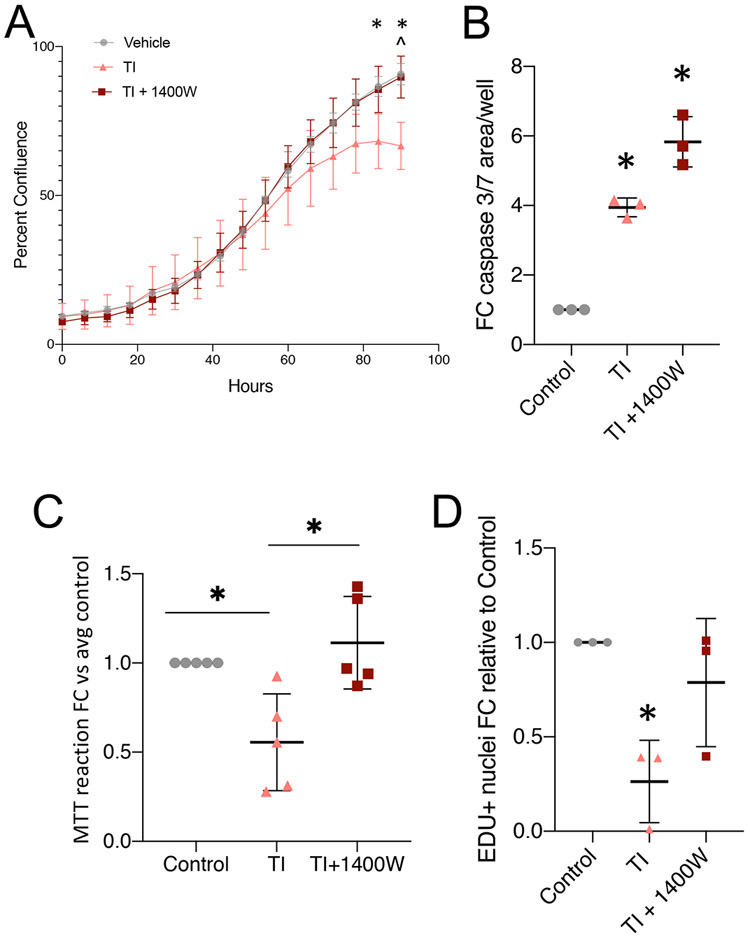
Figure 4:
NOS2 elevation impairs myoblast proliferation A: Proliferation curve over 4 days for control-, TI-, and TI + 1400W-treated myoblasts. Multiple t-test analysis * = pval <0.05 Ctrl vs TI, ^ = pval <0.05 TI+1400W vs TI. Representative of 3 independent replicates. Error bars represent error within 4 well replicates. B: Caspase activity in myoblasts treated for 48 hours. N = 3 independent replicates. C: MTT reaction product detected in myoblasts treated for 24 hours. N = 5 independent replicates. D: EDU incorporation assay after 24-hour treatment with TI or TI+1400W. (B-D) * = pval <0.05 by one-way ANOVA.

