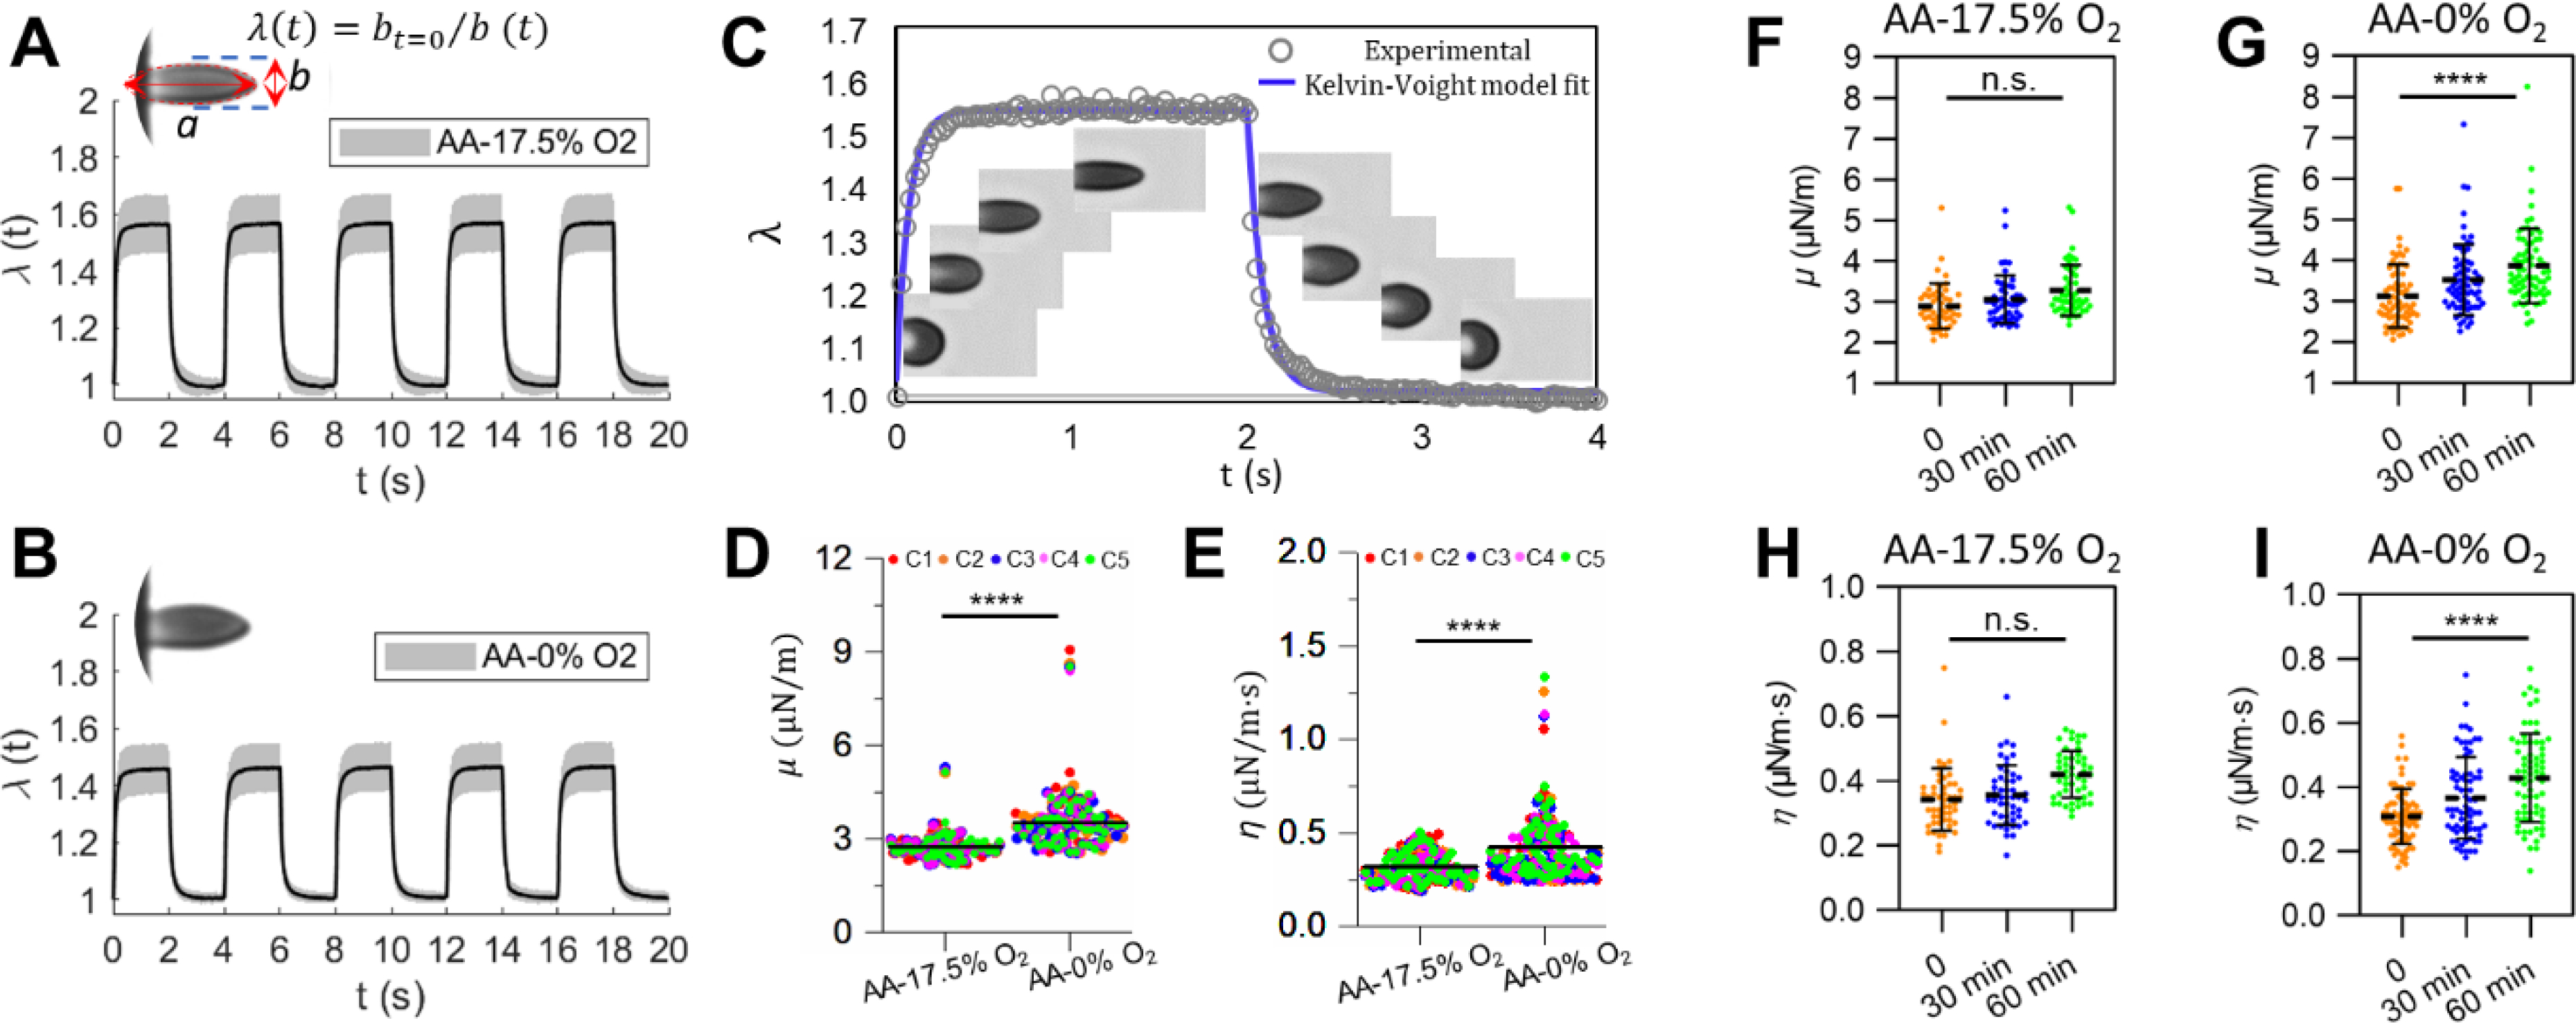
Fig. 2.

Deformability of normal RBCs (AA) measured under different static (i.e. non-cyclic) oxygen conditions. (A and B) Instantaneous values of λ averaged from individually tracked cells in the 5 continuous cycles of mechanical testing. Insets show representative images of deformed cells. (C) Experimental data of viscoelastic deformation for a representative RBC, fitted to the Kelvin-Voight model. Insets are time sequences of microscopic images of a representative RBC. (D and E) Comparisons of the corresponding values of μ,and η of normal RBCs under 17.5% O2 and 0% O2. Each symbol represents a single cell measurement. Each color of the data points represents a different measurement cycle in the 5 cycles (C1-C5). (F and H) Changes in the values of μ and η of normal RBCs under 17.5% O2 lasting for 1 hour. (G and I) Changes in the values of μ and η of normal RBCs under 0% O2 lasting for 60 min. * p < 0.05, ** p < 0.01, *** p < 0.001, **** p < 0.0001, n.s., not significant.
