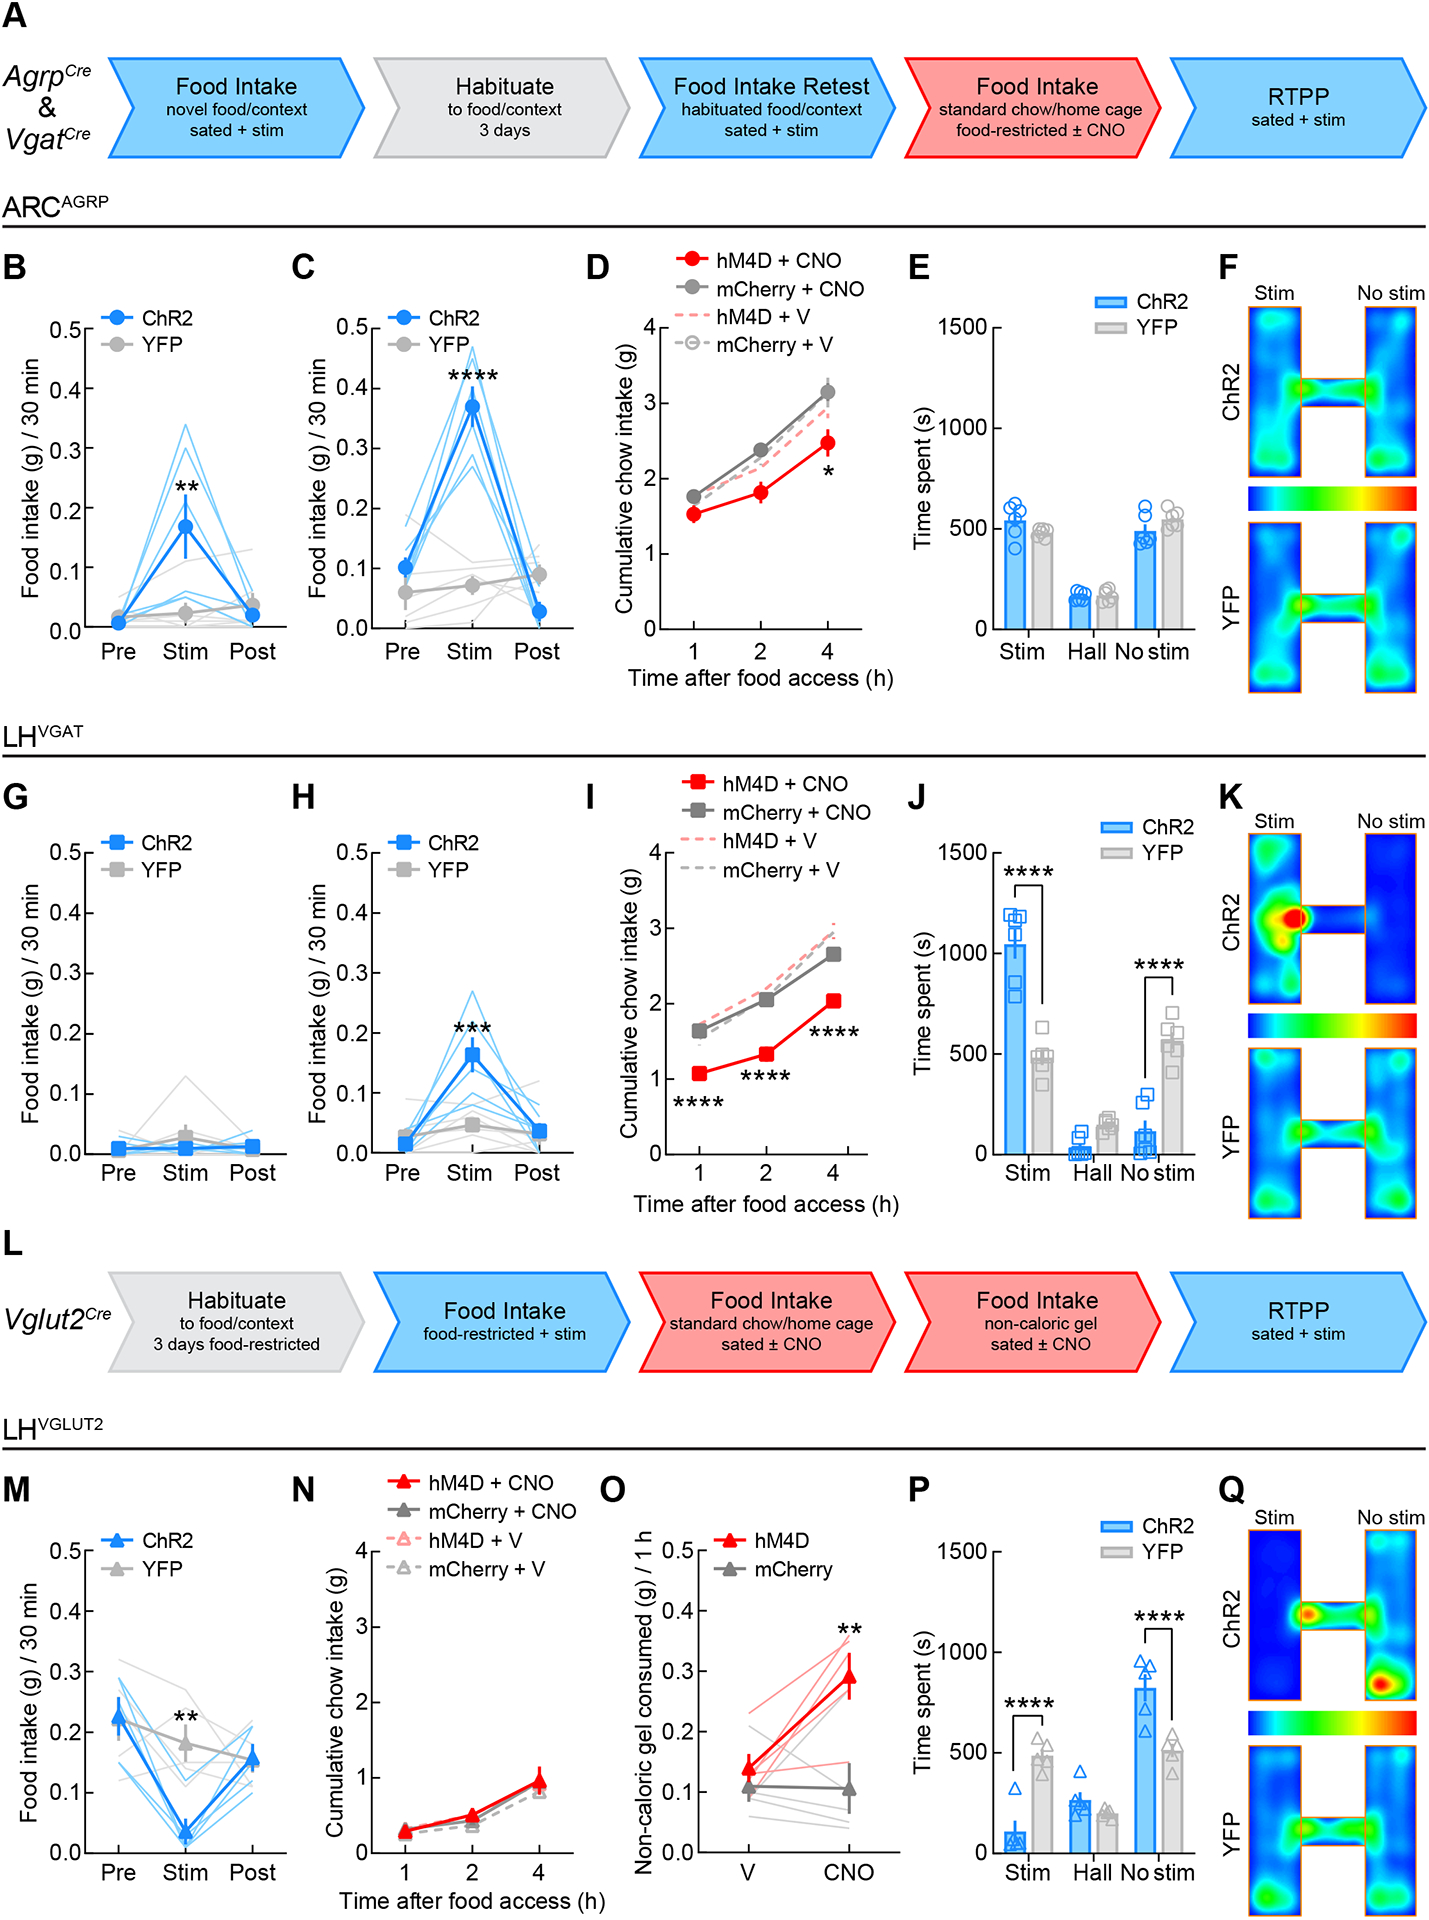
Figure 3. Hypothalamic control of food intake and reward-related behavior.

(A) Flowchart for testing AgrpCre and VgatCre mice in assays of food intake and reward. Blue arrow segments indicate tests with optogenetic activation of neurons and red arrow segments indicate tests with chemogenetic inhibition of neurons.
(B) ARCAGRP activation in sated mice triggered consumption of novel food pellets in a novel context (two-way mixed-model ANOVA group × epoch interaction: F(2, 20) = 8.32, p = 0.0023; Bonferroni’s post-test: **p = 0.001) as well as (C) food pellet consumption following habituation (F(2, 20) = 42.81, p < 0.0001; Bonferroni’s post-test: ****p < 0.0001). n = 6 mice per group.
(D) ARCAGRP inhibition in food-restricted mice decreased standard chow intake by 4 h post-food access (three-way mixed-model ANOVA revealed a significant main effect of time (F(2,18) = 193.9, p < 0.0001), with significant interactions of time × group (F(2, 18) = 5.07, p = 0.18) and treatment × group (F(1, 9) = 8.73, p = 0.16). Tukey’s post-test revealed between-group differences in food intake during CNO treatment at 4 h post-food access, *p = 0.015). n = 6 ARCAGRP:hM4D and n = 5 ARCAGRP:YFP.
(E) ARCAGRP activation did not evoke reward- or aversive-like effects in the real-time place preference test (n = 6 mice per group; two-way mixed-model ANOVA group × chamber interaction: F(2, 20) = 2.54, p = 0.10).
(F) Group average location RTPP heat maps for ARCAGRP:ChR2 (n = 6) and ARCAGRP:YFP (n = 6) mice. Scale is percentage of time spent in location.
(G) LHVGAT activation in sated mice did not evoke food pellet intake under novel food and context conditions (F(2, 20) = 0.85, p = 0.44) and (H) only triggered intake post-habituation (F(2, 20) = 9.74, p = 0.001; Bonferroni’s post-test: ***p = 0.0001). n = 6 mice per group.
(I) LHVGAT inhibition in food-restricted mice decreased standard chow intake throughout the 4 h feeding test (three-way mixed-model ANOVA revealed significant main effects of time (F(2,20) = 391.5, p < 0.0001), treatment (F(1, 10) = 64.00, p < 0.0001), and group (F(1, 10) = 15.59, p = 0.0027), with significant interactions of time × treatment (F(2, 20) = 19.01, p < 0.0001) and treatment × group (F(1, 10) = 45.02, p < 0.0001). Tukey’s post-test revealed between-group differences in chow intake during CNO treatment at 1-, 2-, and 4-h post-food access (****p < 0.0001). n = 6 mice per group.
(J) LHVGAT activation triggered significant reward-like effects in the real-time place preference test (n = 6 mice per group; two-way mixed-model ANOVA group × chamber interaction: F(2, 20) = 45.13, p < 0.0001). Bonferroni’s post-test revealed between-group differences in time spent in the stimulation-paired and -unpaired chambers (****p < 0.0001) but no differences in the time spent in the hallway compartment (p = 0.25).
(K) Group average location RTPP heat maps for LHVGAT:ChR2 (n = 6) and LHVGAT:YFP (n = 6) mice. Scale is percentage of time spent in location.
(L) Flowchart for testing Vglut2Cre mice. Blue arrow segments indicate tests with optogenetic activation of neurons and red arrow segments indicate tests with chemogenetic inhibition of neurons.
(M) LHVGLUT2 activation in food-restricted mice significantly decreased standard chow intake (F(2, 16) = 5.88, p = 0.012; Bonferroni’s post-test: **p = 0.0035). n = 5 LHVGLUT2:ChR2 and n = 6 LHVGLUT2:YFP.
(N) LHVGLUT2 inhibition in sated mice did not change standard chow intake over 4 h (three-way mixed model ANOVA only revealed a significant main effect of time: F(2, 16) = 160.5, p < 0.0001) but (O) did increase intake of a novel non-caloric gel (F(1, 8) = 5.98, p = 0.04; Bonferroni’s post-test: **p = 0.0025). n = 5 LHVGLUT2:ChR2 and n = 6 LHVGLUT2:YFP.
(P) LHVGLUT2 activation triggered significant aversive-like effects in the real-time place preference test (n = 5 LHVGLUT2:ChR2 and n = 6 LHVGLUT2:YFP; two-way mixed-model ANOVA group × chamber interaction: F(2, 16) = 21.93, p < 0.0001). Bonferroni’s post-test revealed between-group differences in time spent in the stimulation-paired and -unpaired chambers (****p < 0.0001) but no differences in the time spent in the hallway compartment (p = 0.86).
(Q) Group average location RTPP heat maps for LHVGLUT2:ChR2 (n = 5) and LHVGLUT2:YFP (n = 6) mice. Scale is percentage of time spent in location.
See also Figures S2–S4.
