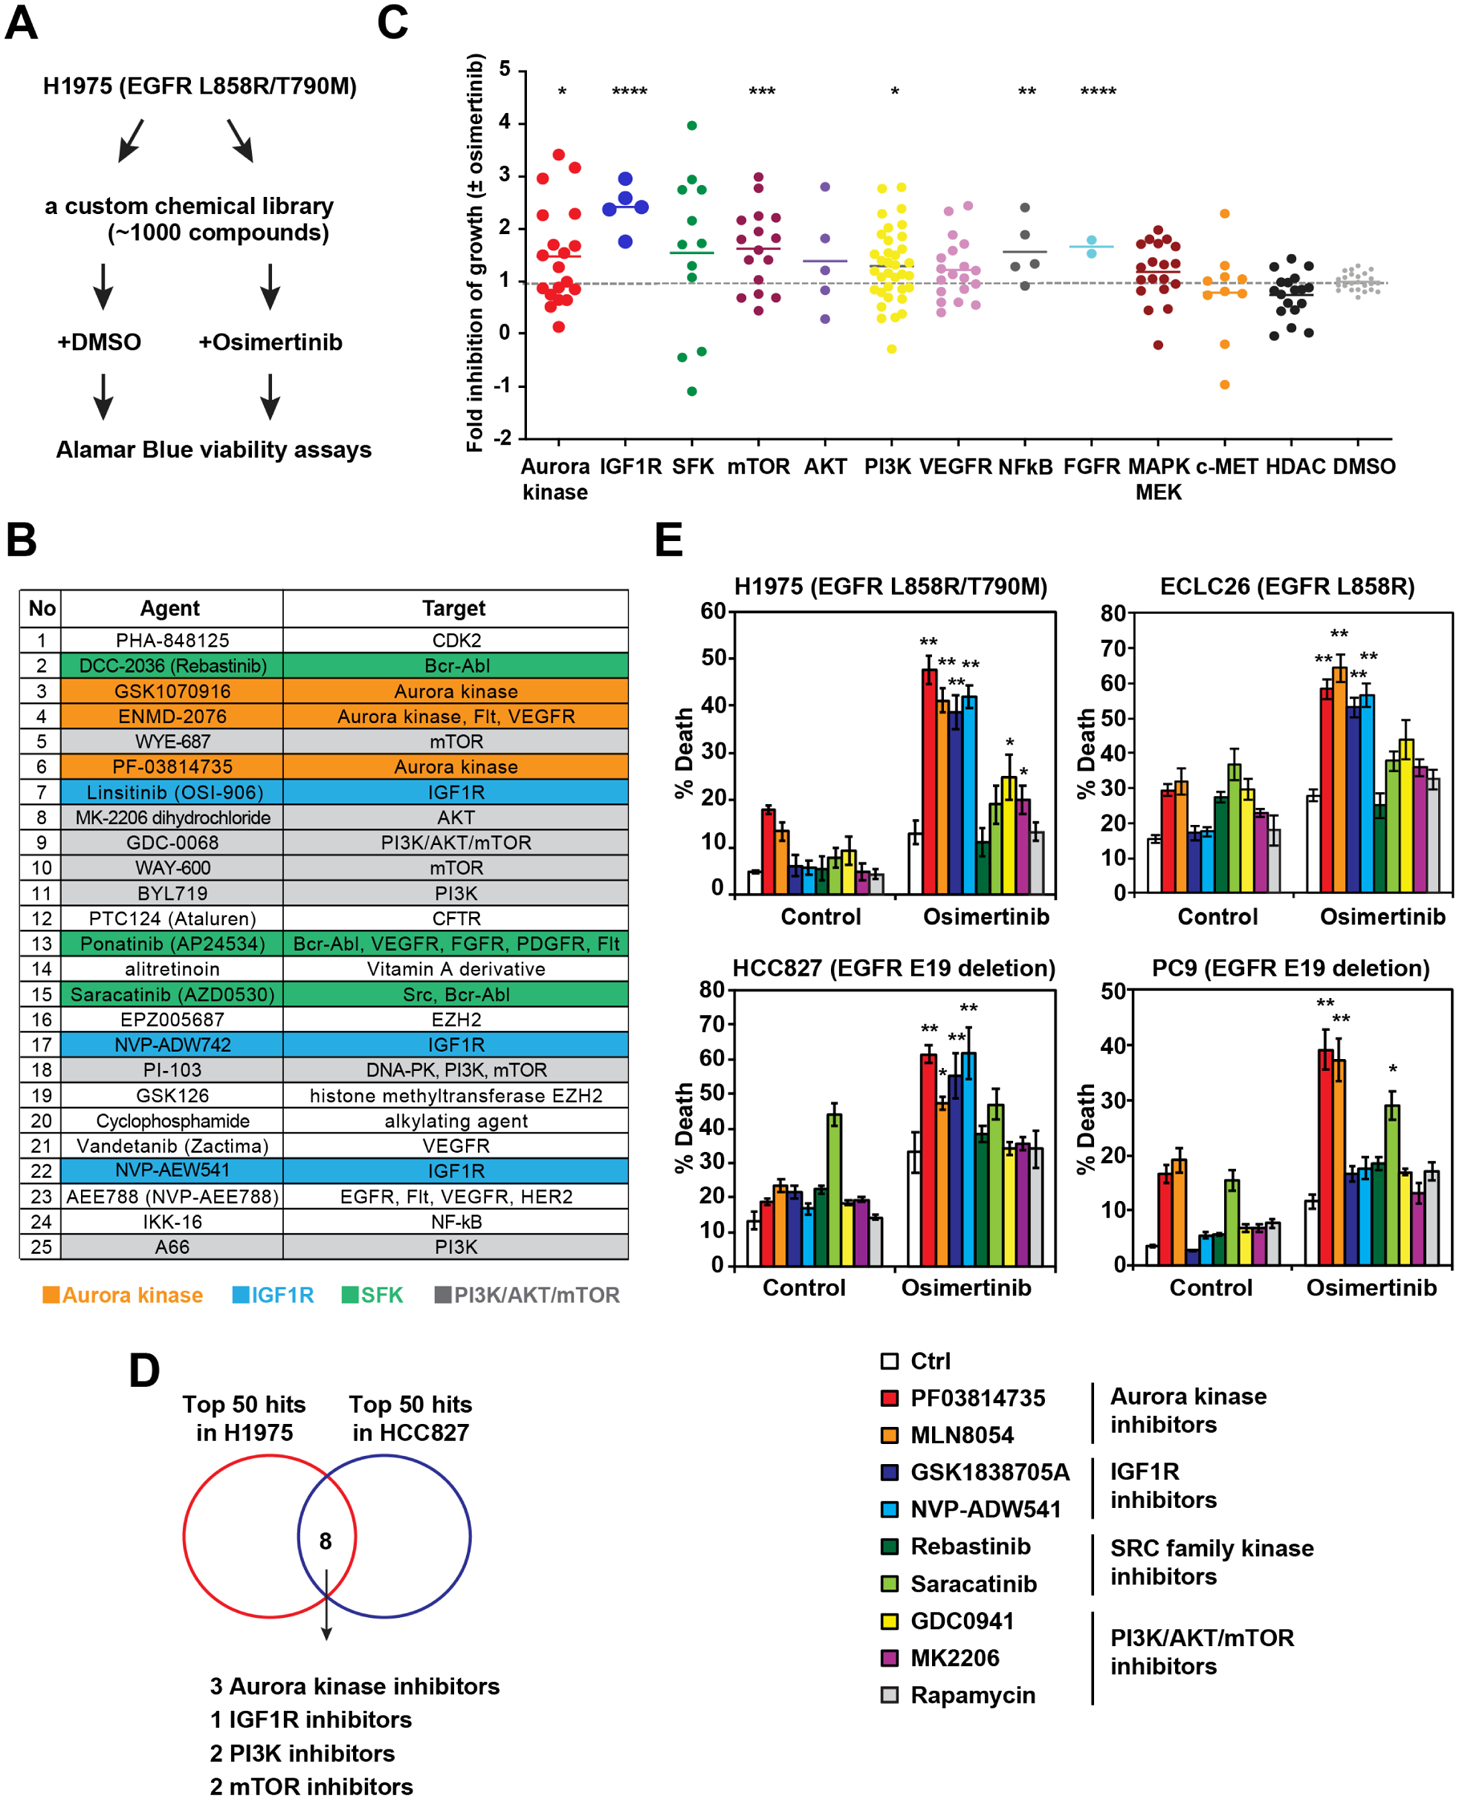
Figure 1. HTS identifies Aurora kinase inhibitors as potent enhancers of osimertinib-induced apoptosis in EGFR-mutant lung cancer.

(A) A schematic of HTS to identify agents that enhance osimertinib (osi)-induced growth inhibition. H1975 was treated with each compound from the library (2 μM) ± osi (2 μM) in duplicate. Cell viability was assessed by alamarBlue assays at 72 h.
(B) Top 25 agents that enhance osi-induced growth inhibition of H1975. Green cluster, SRC family kinase inhibitors; orange, Aurora kinase inhibitors (AKi); gray, PIK3/AKT/mTOR inhibitors; and blue, IGF1R inhibitors.
(C) An overview of growth inhibition of H1975 by various pathway inhibitors ± osi. Fold inhibition of growth by the combination of each compound with osi compared to each compound alone was normalized against that by osi. *, P<0.05; **, P<0.01; ***, P<0.001; ****, P<0.0001 (Mann-Whitney U test).
(D) A Venn diagram of top 50 agents that enhance osi-induced growth inhibition of H1975 and HCC827.
(E) Cells were treated with the indicated compounds ± osi for 48 h. Cell death was quantified by annexin-V (AV) staining (mean ± s.d., n=3). *, P<0.05; **, P<0.01 (Student’s t-test).
See also Figure S1.
