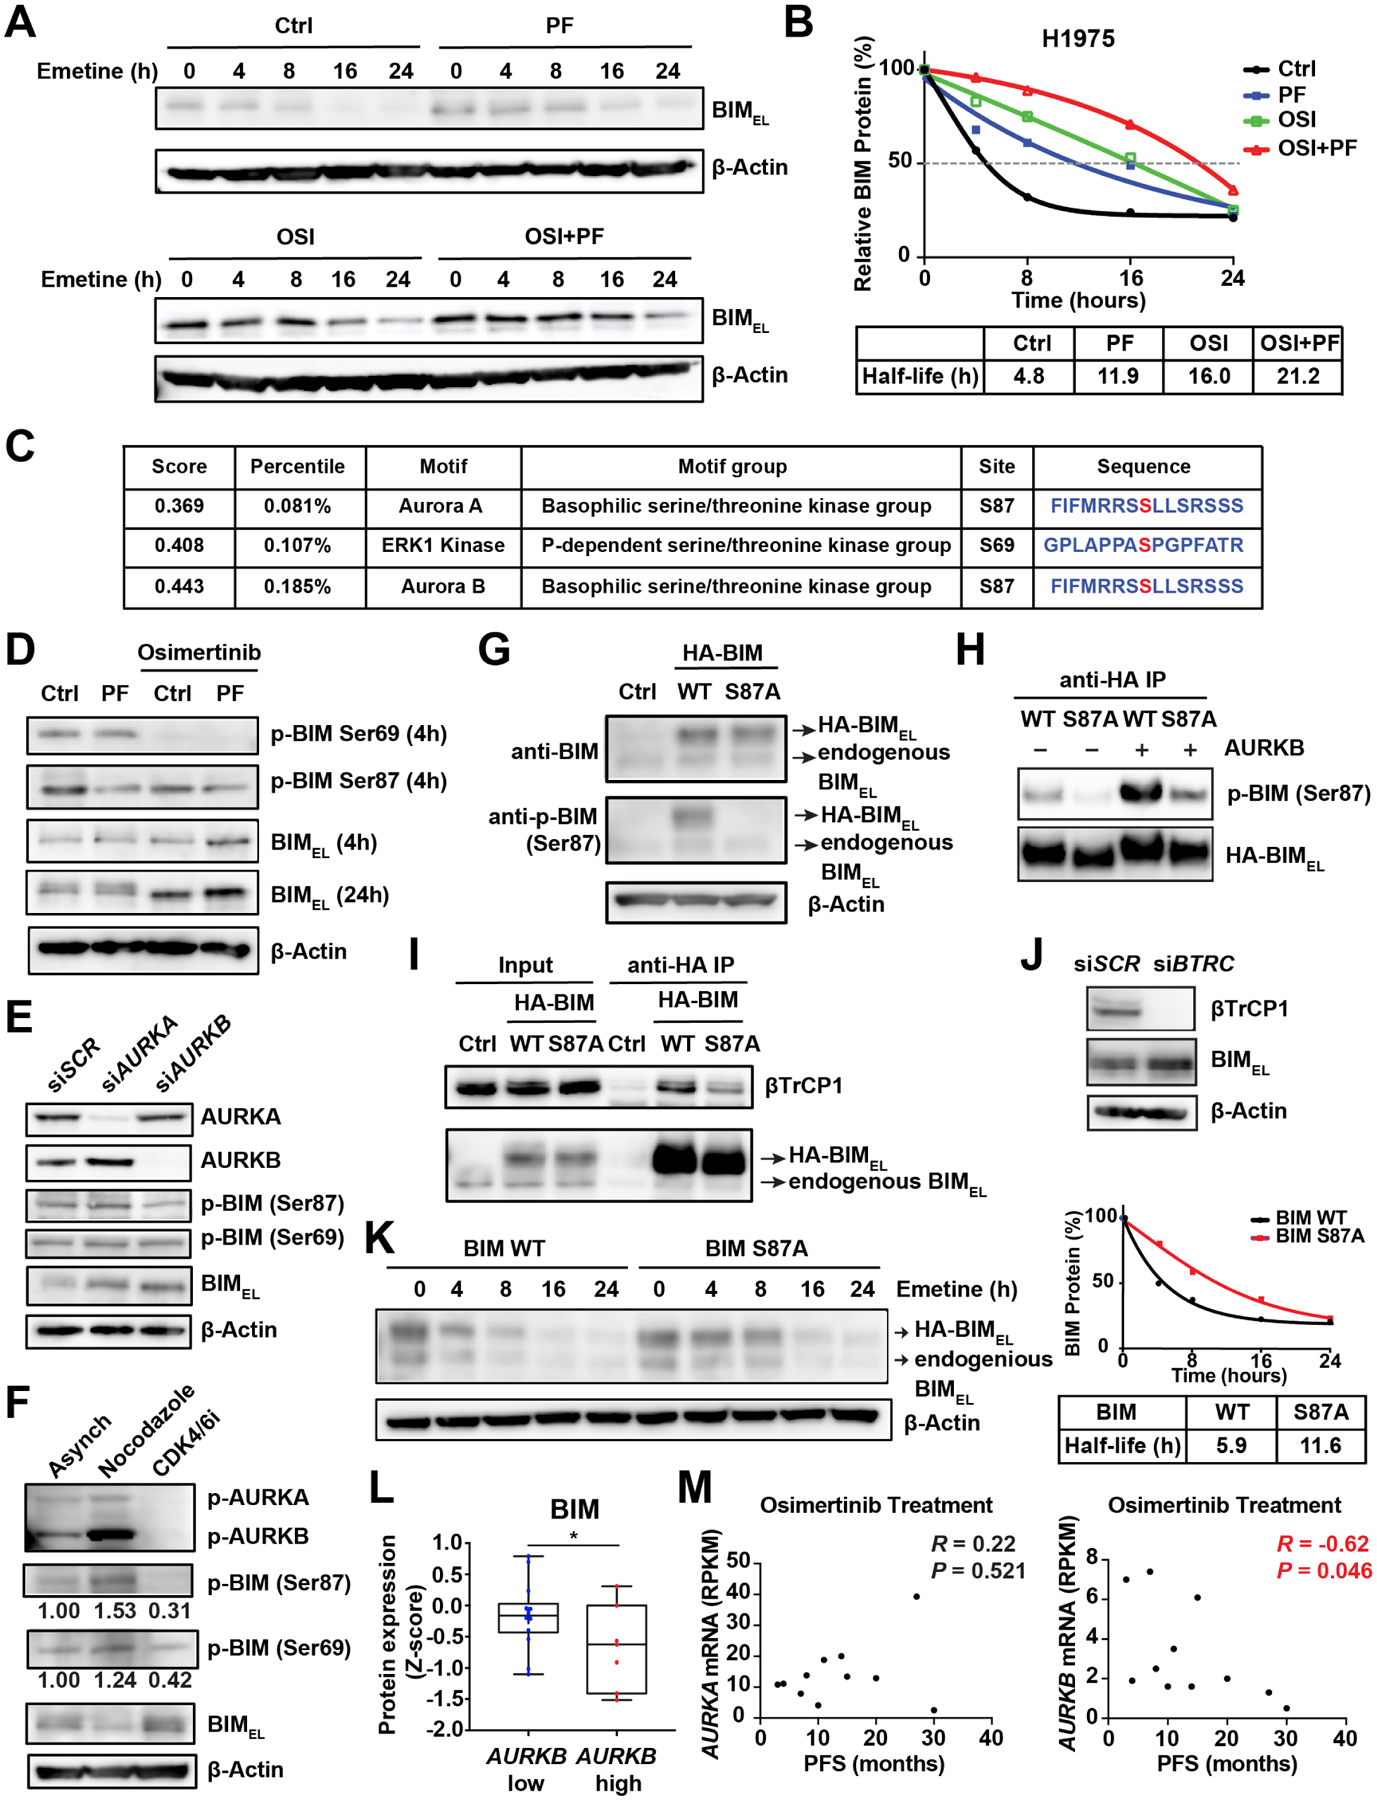
Figure 3. AURKB inhibition reduces BIM S87 phosphorylation and stabilizes BIM protein.

(A) H1975 was treated with osi (2 μM) and/or PF (2 μM) for 4 h, followed by the addition of emetine (20 μg/ml) to inhibit translation. Immunoblot analyses were performed at the indicated times.
(B) The half-life of BIM protein upon treatment with the indicated agents as in (A). The anti-BIM immunoblots shown in (A) were quantified by the ImageJ software and plotted with respect to time. Data shown are the mean of two independent experiments.
(C) Prediction of potential kinase phosphorylation motifs in BIM using the SCANCITE 4.0 software.
(D) H1975 treated with the indicated agents as in (A) for 4 or 24 h was assessed by immunoblots.
(E) H1975, transfected with the indicated siRNAs, was assessed by immunoblots.
(F) H1975 treated with nocodazole (50 ng/ml) for 16 h or the CDK4/6 inhibitor palbociclib (1 μM) for 24 h was assessed by immunoblots.
(G) BAX−/−BAK−/− H1975 was transduced with retrovirus expressing HA-tagged WT BIM or BIM S87A mutant and assessed by immunoblots.
(H) H1975 as in (G) was treated with palbociclib (1 μM) for 24 h and subjected to anti-HA immunoprecipitation. The immunoprecipitates were incubated with recombinant AURKB in the presence of ATP and assessed by immunoblots.
(I) H1975 as in (G) was subjected to anti-HA immunoprecipitation. The input (5%) and immunoprecipitates were assessed by immunoblots.
(J) H1975, transfected with the indicated siRNAs, was assessed by immunoblots.
(K) H1975 as in (G) was treated with emetine (20 μg/ml) and assessed by immunoblots. The BIM protein levels were quantified by the ImageJ software and plotted with respect to time. Data shown are the mean of two independent experiments.
(L) The expression of BIM protein in EGFR-mutant LUAD with high or low expression of AURKB mRNA from TCGA (n=22). *, P<0.05 (Student’s t-test).
(M) Scatter plots showing the correlation between progression-free survival (PFS) following osi treatment and pretreatment mRNA levels of AURKA or AURKB in EGFR-mutant LUAD patients (n=11).
See also Figure S3.
