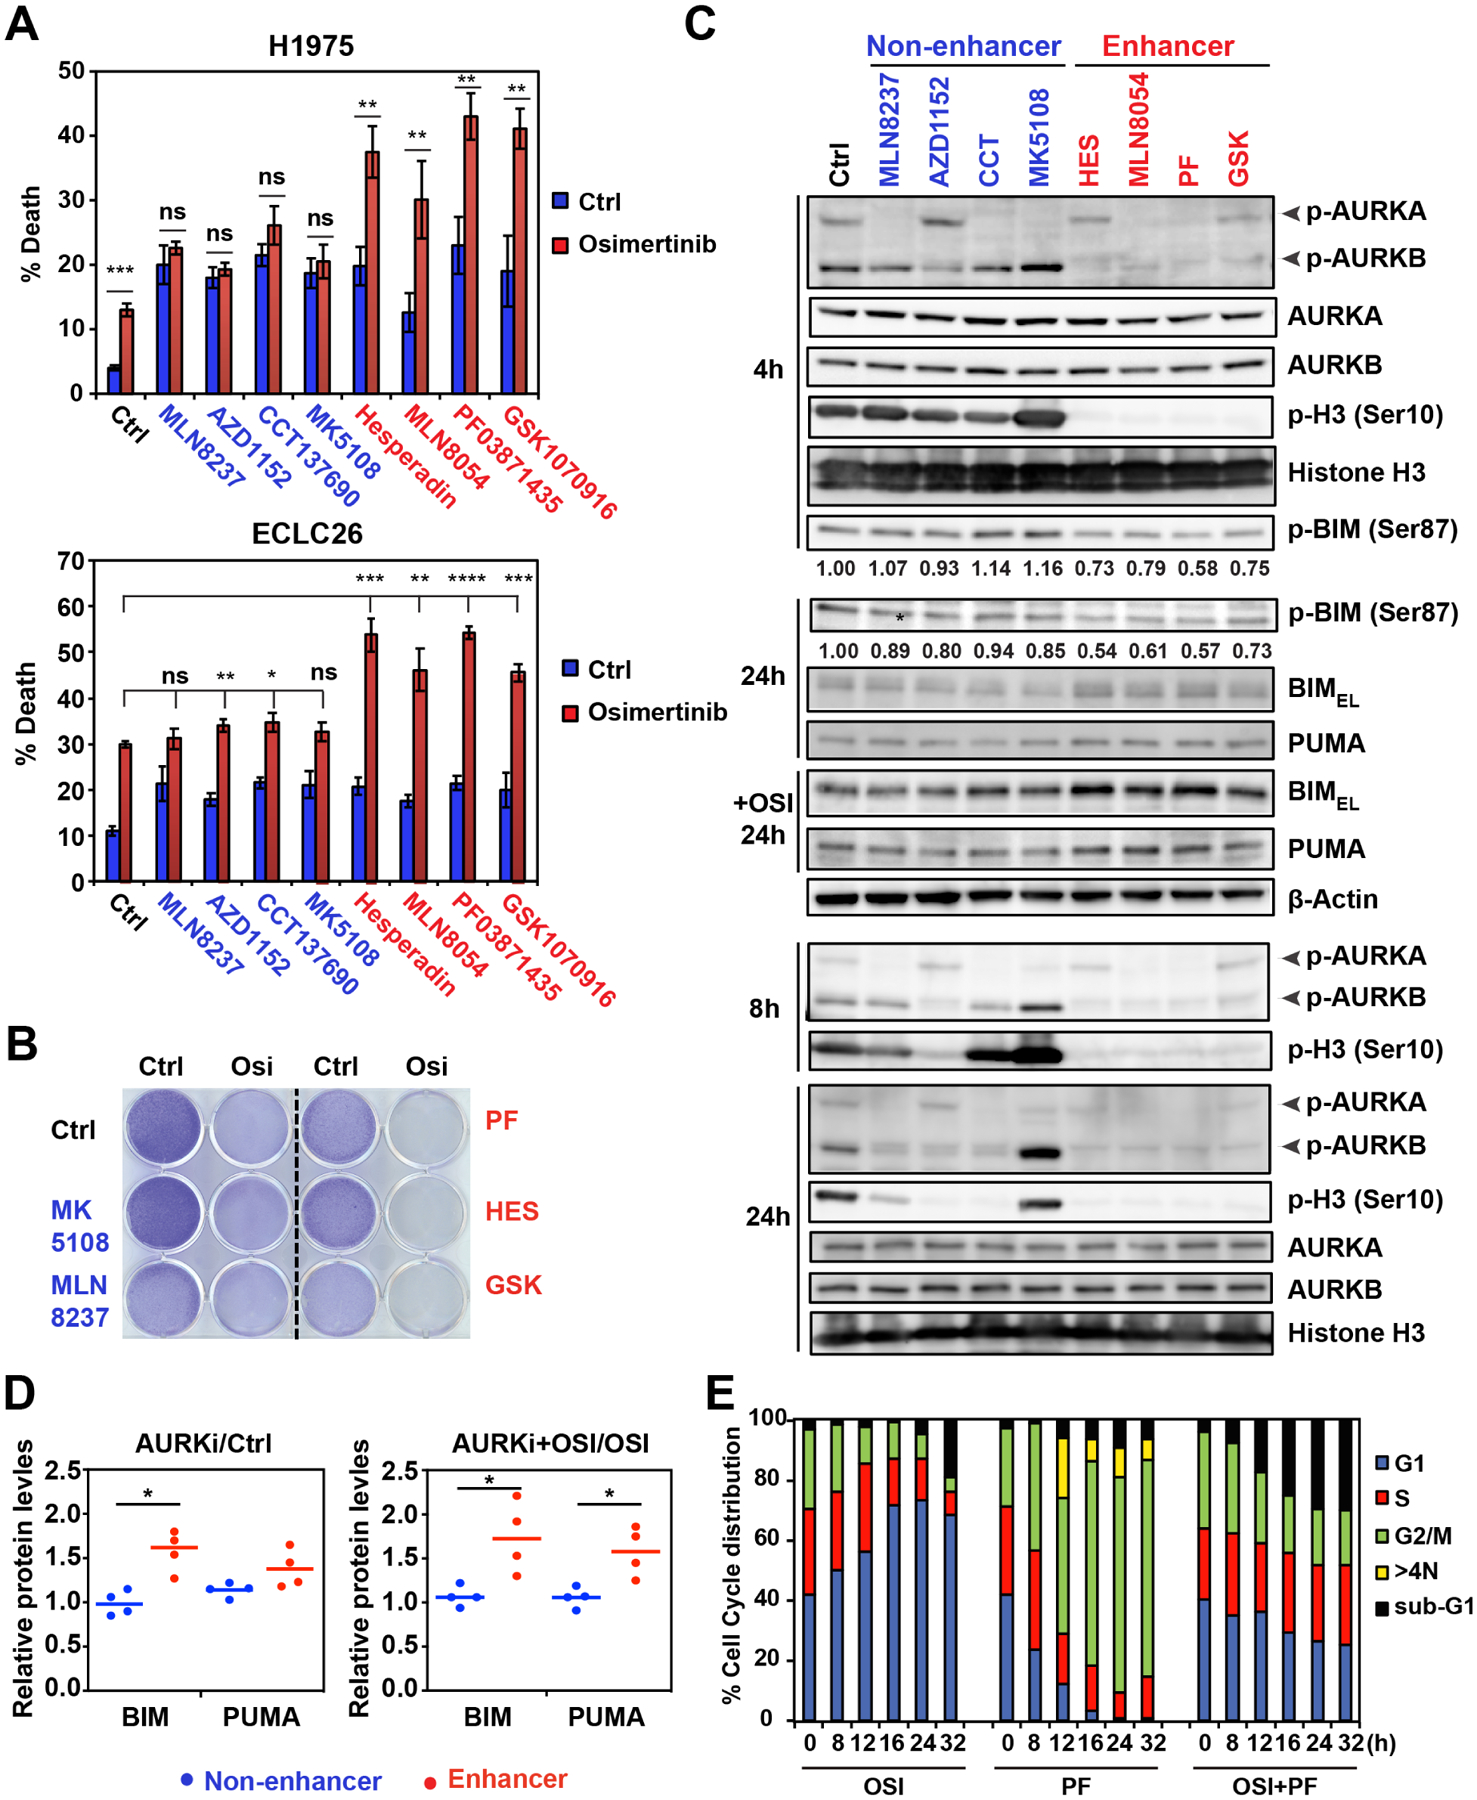
Figure 4. Aurora kinase inhibitors are divided into enhancer and non-enhancer groups of osimertinib-induced apoptosis.

(A) H1975 and ECLC26 were treated with the indicated AKi (1 μM) ± osi (1 μM) for 48 h. Cell death was quantified by AV staining (mean ± s.d., n=3). *, P<0.05; **, P<0.01; ***, P<0.001; ****, P<0.0001 (Student’s t-test).
(B) H1975 was treated with the indicated agents (1 μM) and colonies were stained with crystal violet after 14 days.
(C) H1975 treated as in (A) was assessed by immunoblots at the indicated times.
(D) The anti-BIM and anti-PUMA immunoblots shown in C were quantified by the ImageJ software. Data presented are the ratio of BIM and PUMA protein levels upon the treatment of AKi compared to control and the ratio upon the treatment of both AKi and osi compared to osi alone. *, P<0.05 (Student’s t-test).
(E) H1975 was treated with osi (1 μM) and/or PF (1 μM) and subjected to cell-cycle analysis using propidium iodide (PI) staining at the indicated times.
See also Figure S4.
