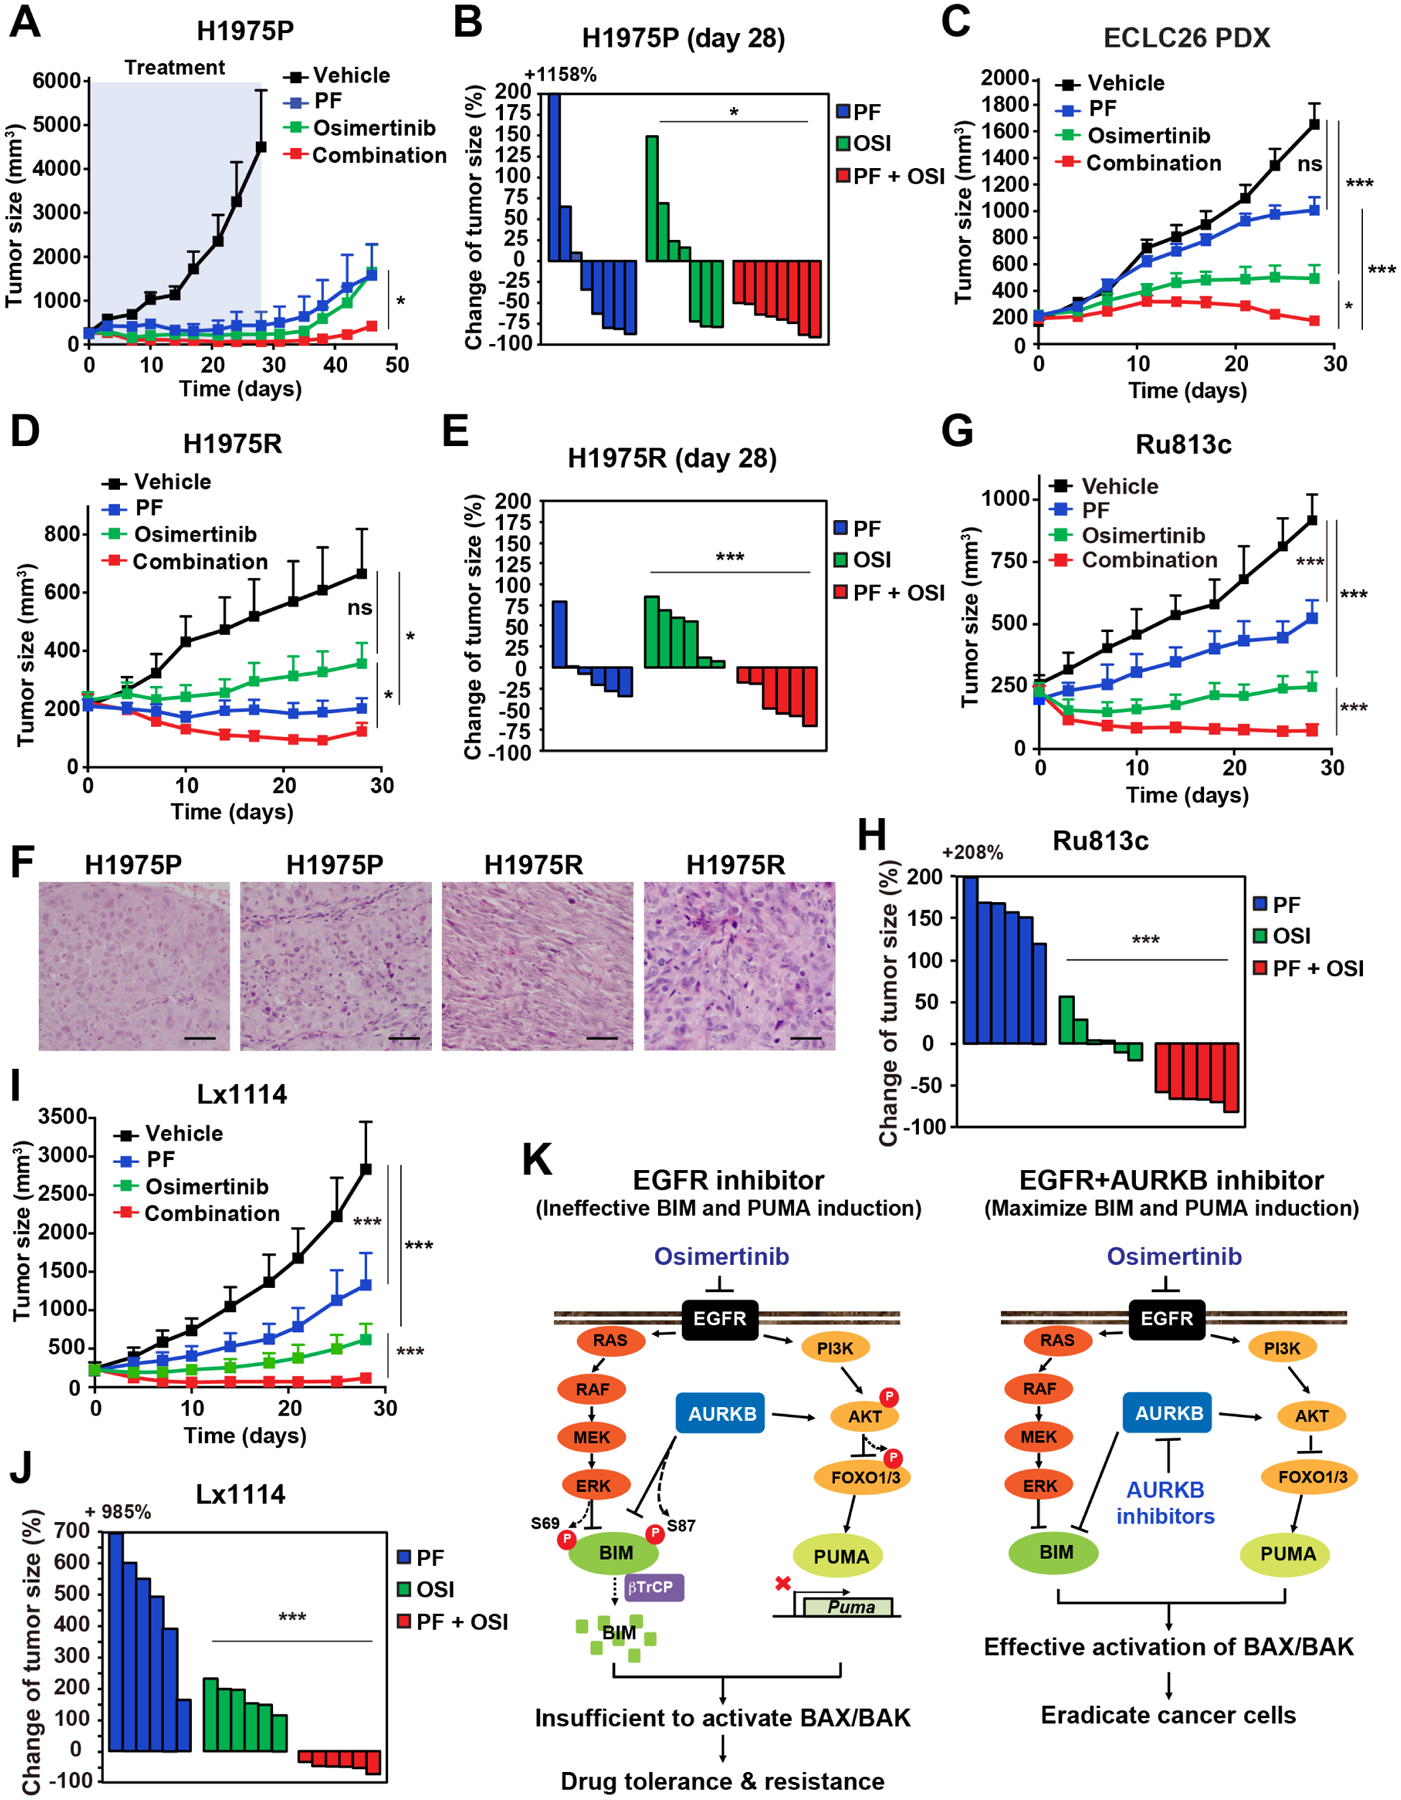
Figure 7. Aurora kinase inhibition improves the therapeutic efficacy of osimertinib in xenograft models.

(A) Athymic nude mice bearing H1975 xenografts were treated with vehicle, osi (5 mg/kg), PF (20 mg/kg), or the combination for 28 days. Tumor volumes were measured twice weekly by caliper (mean ± SEM, n = 6–8 for each group). *, P < 0.05 (two-way ANOVA).
(B) Waterfall plot of changes in tumor volume after 28 days of treatment in (A). *, P < 0.05 (Student’s t-test).
(C) NOD.Cg-Prkdcscid Il2rgtm1Wjl/SzJ (NSG) mice bearing patient-derived ECLC26 xenografts were treated as in (A) (mean ± SEM, n = 8–12 for each group). *, P < 0.05; ***, P < 0.001 (two-way ANOVA).
(D) Athymic nude mice bearing H1975R xenografts were treated as in (A) (mean ± SEM, n = 6–8 for each group). *, P < 0.05 (two-way ANOVA).
(E) Waterfall plot of changes in tumor volume in (D). ***, P < 0.001 (Student’s t-test).
(F) Representative H&E images of xenografts established using either H1975 or H1975R cells. Scale bars, 200 μm.
(G) NSG mice bearing patient-derived Ru813c xenografts were treated as in (A) (mean ± SD, n = 6 for each group). ***, P < 0.001 (two-way ANOVA).
(H) Waterfall plot of changes in tumor volume in (G). ***, P < 0.001 (Student’s t-test).
(I) NSG mice bearing patient-derived Lx1114 xenografts were treated as in (A) (mean ± SD, n = 6 for each group). ***, P < 0.001 (two-way ANOVA).
(J) Waterfall plot of changes in tumor volume in (I). ***, P < 0.001 (Student’s t-test).
(K) A schematic summarizing how EGFR and AURKB regulate the proapoptotic activity of BIM and PUMA.
