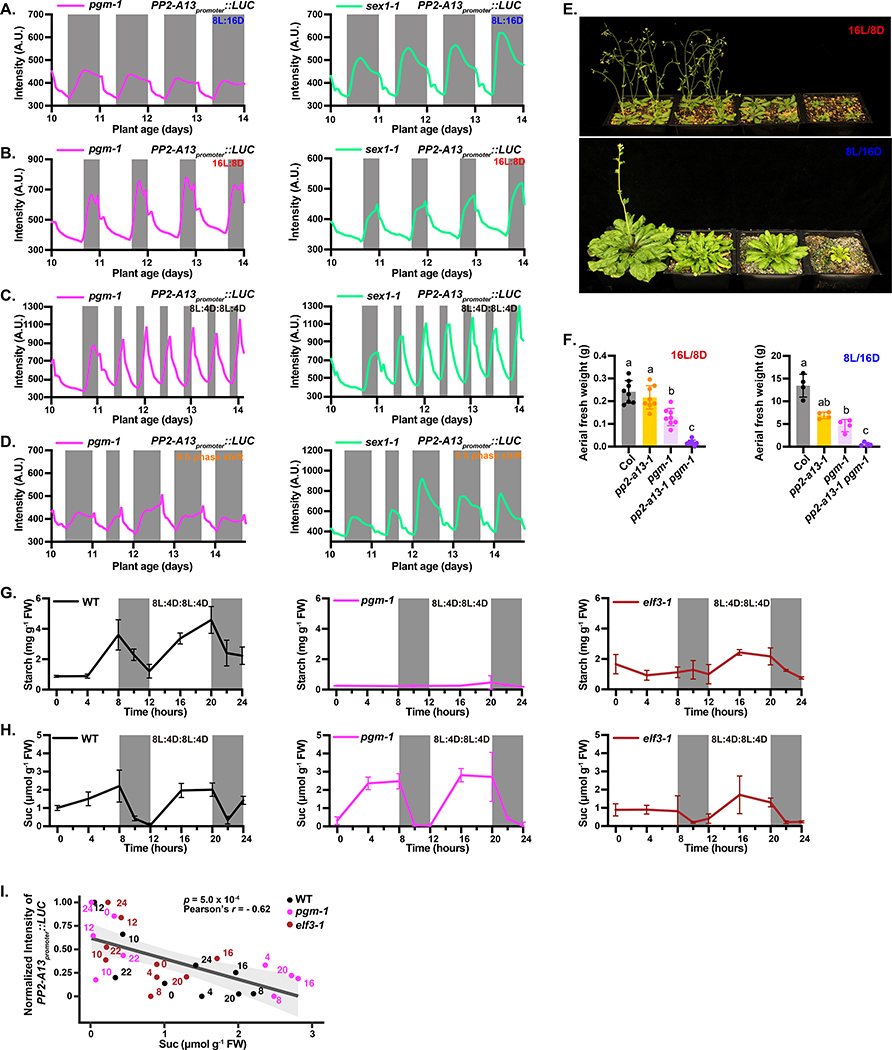
Figure 7. Starch synthesis and degradation are required for PP2-A13 photoperiodic gene expression.
(A-D) PP2-A13promoter∷Luciferase traces from pgm-1 and sex1–1 mutant plants grown in (A) 8L:16D, (B) 16L:8D, (C) 8L:4D:8L:4D, and (D) phase shift. (E) Representative wild type (Col), pp2-a13–1, pgm-1, and pgm-1 pp2-a13–1 double mutants grown for 31 days in 16L:8D or 11 weeks in 8L:16D. (F) Aerial fresh weight of wild type (Col), pp2-a13–1, pgm-1, and pgm-1 pp2-a13–1 double mutants grown for 25 days in 16L:8D or 11 weeks in 8L:16D. Different letters indicate significant differences as determined by one-way ANOVA followed by Dunnett’s T3 multiple comparison test; p⩽0.05. Error bars indicate SD (n = 4–8). (G-H) Starch (G) and sucrose (H) levels from wild type (Col), pgm-1, and elf3–1 mutants. Note: n = 2 for the starch level at ZT10 in wild type and for the sucrose level at ZT8, 10, and 12 in wild-type and ZT0 in the elf3–1 mutant. In those cases, the error bar indicates the two sample values. n = 3 for all the other time points, error bar indicates SD. (I) Correlation between sucrose levels from wild type (Col), pgm-1, and elf3–1 mutants (Fig. 7H) and averaged normalized levels of PP2-A13promoter∷Luciferase from day 12 to day.14 (WT: Fig. S7E; pgm-1: Fig. 7C; elf3–1: Fig. 5C). Significance was determined by Pearson’s correlation test. Numbers at each data point indicate the number of hours from dawn. Grey line and shading indicate line of best fit and 95% confidence interval, respectively.

