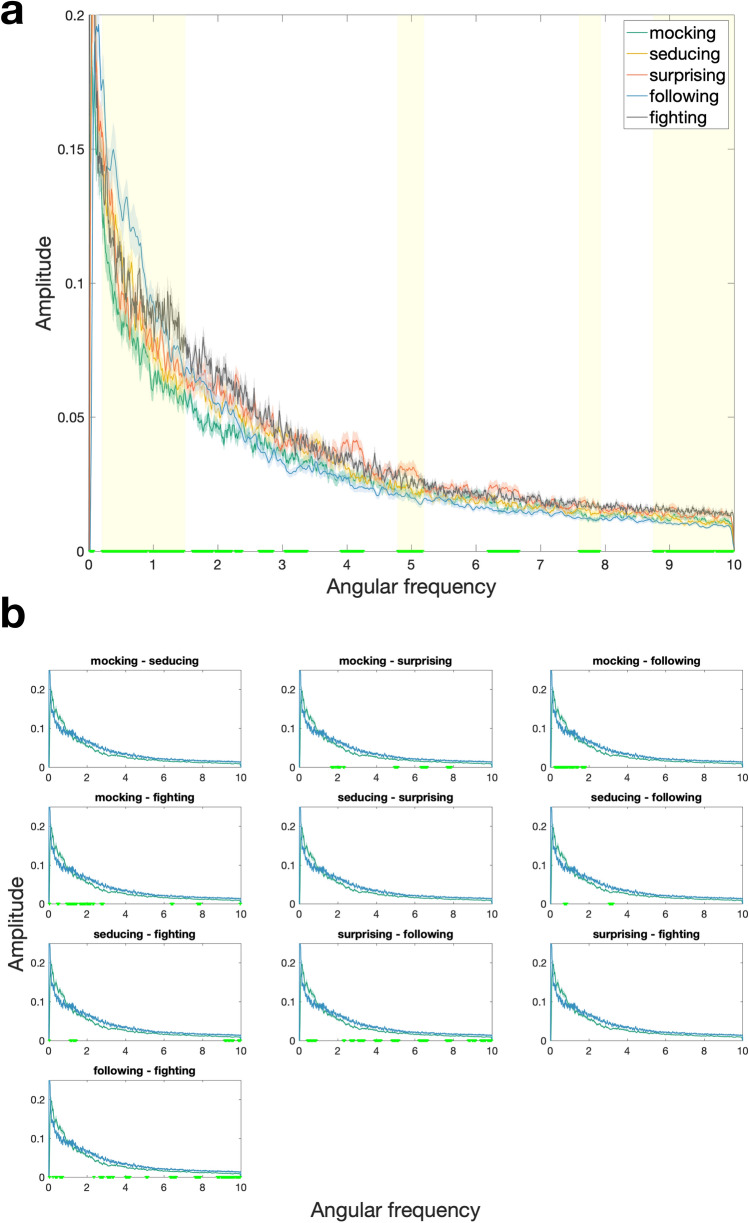
Figure 3.
(a) Significant clusters of difference in angular frequency spectral density (AFSD). Solid colored lines represent spectral density as a function of angular frequency per word (i.e., AFSD), the corresponding shaded areas represent 1 SEM (standard error of the mean) below and above the mean values. Yellow bars on x-axis represent clusters where AFSD significantly differs between mocking, seducing, surprising, following and fighting. Clusters that are predictive of accuracy are highlighted in yellow. Note that the lowest angular frequency derived from the data varied between 0.02 and 0.09, resulting in extrapolated values for some participants. For this reason, the first cluster of difference ranging from 0.02 to 0.09 was considered not representative of actual movements and disregarded. (b) Post-hoc comparisons of AFSD.

