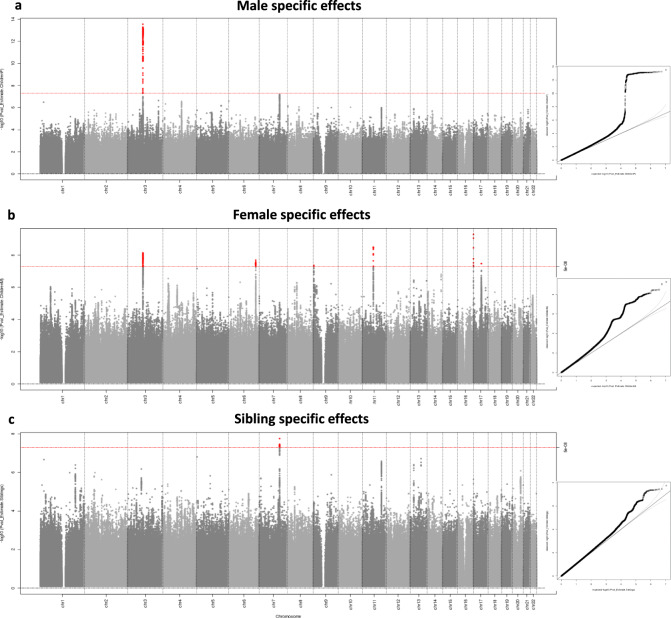
Fig. 3. Manhattan plot and quantile–quantile (Q–Q) plot for the fertility GWAS estimating male, female and sibling-specific genetic effects using Genomic SEM.
237,768 women from the UK Biobank contributed to the unconditional GWAS of the number of children mothered, 199,570 men contributed to the GWAS of the number of children fathered and 430,466 individuals contributed to the GWAS of the number of siblings (see Supplementary Fig. 26 for the Manhattan plots of the unconditional GWAS). Point estimates for male, female and sibling effects and their standard errors were estimated using diagonally weighted least squares as implemented in Genomic SEM, and two-sided P-values obtained from Z tests on these estimates. The two-sided association P-value, on the −log10 scale, obtained from Genomic SEM for each of the SNPs (y-axis) was plotted against the genomic position (NCBI Build 37; x-axis). Association signals that reached genome-wide significance (P < 5 × 10⁻⁸) are shown in red. In the Q–Q plots, the black dots represent observed two-sided P-values and the grey line represents expected two-sided P-values under the null distribution. The SNP heritability, estimated using LD score regression, was 0.033 (SE = 0.003) for male fertility, 0.042 (SE = 0.003) for female fertility and 0.012 (SE = 0.001) for sibling-specific effects. P-values are not adjusted for multiple comparisons.

