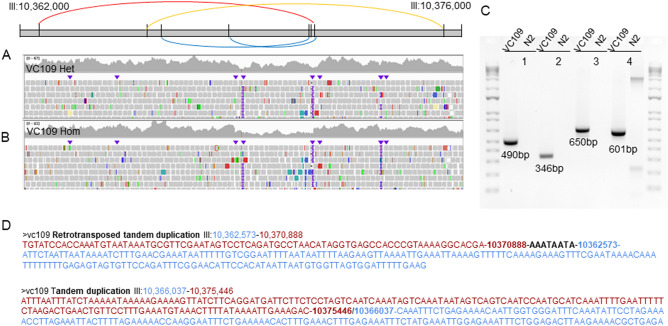
Figure 4.
Complex rearrangement in VC109 on LGIII. (A) Schematic representation of the complex rearrangement combining one inverted tandem duplication (red), one direct tandem duplication (orange), and two deletions (blue) along LGIII around 10 Mb. (B) IGV screenshot for the region overlapped by the complex rearrangements. (C) PCR gels. 1 = Inverted tandem duplication III:10,362,573–10,370,888; 2 = Deletion III:10,366,492–10,370,879; 3 = Direct tandem duplication III:10,366,037–10,375,446; 4 = Deletion III:10,368,666–10,371,166. (D) Sequences obtained with Sanger sequencing displaying regions surrounding breakpoint junctions for the two duplications of the complex rearrangement. The blue and red sequences represent the sequence surrounding the breakpoints and coming from parts of the reference genome away from each other.

