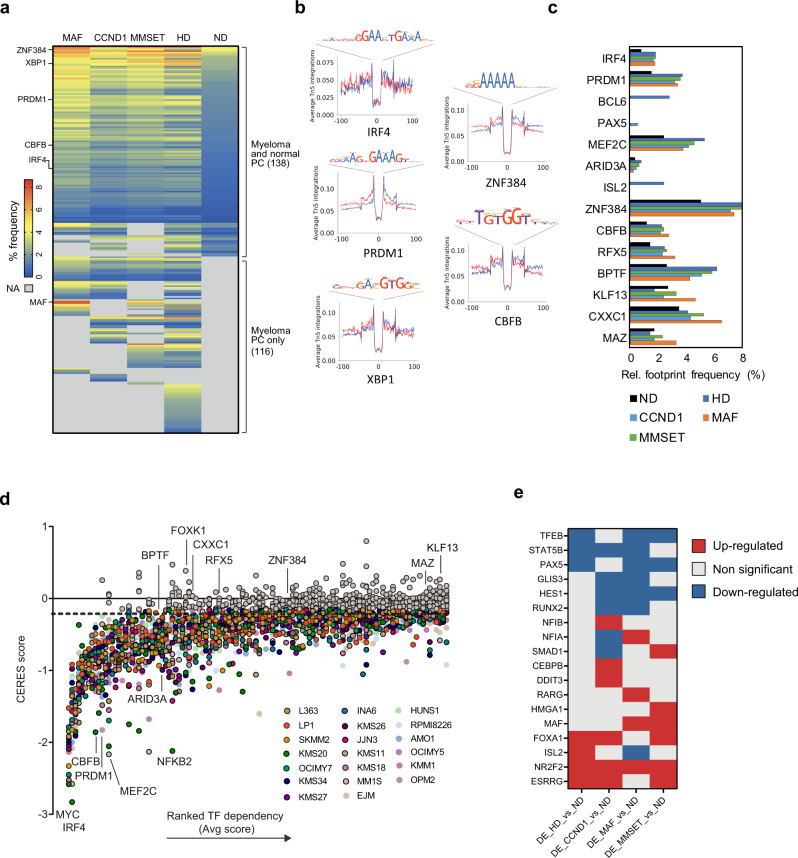
Fig. 3. ‘Rewiring’ of transcription factors underpins aberrant regulatory gene networks in MM.
a Heatmap representation of the relative frequency of TF footprints across different MM genetic subgroups. TF are clustered based on their presence in both normal donor and myeloma PC (top) or in myeloma PC only (bottom). Grey values indicate lack of TF expression and/or predicted binding. b Footprints of indicated TFs identified in HD myeloma PC as determined by ATAC-seq. c Difference in relative footprint frequency of active TFs between different myeloma subgroups and normal donor PC. d TF dependency analysis using high-throughput CRISPR screens data from DepMap database (20 myeloma cell lines representing CCND1, MAF and MMSET genetic subgroups; colour-coded). Of the 247 TF shown, 137 are predicted to generate dependency, the top 100 of which are shown here. Examples of established and novel (bold) dependencies are indicated. In this analysis, dependency is defined as CERES score < −0.2 (horizontal dotted line) in at least 4/20 myeloma cell lines. e) TF that are differentially expressed between ND PC and myeloma genetic subgroup PC.

