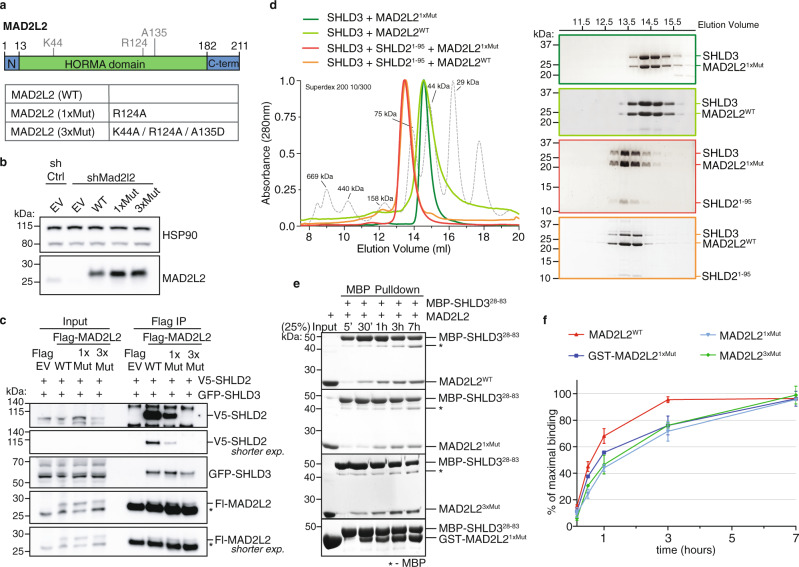
Fig. 1. MAD2L2 forms a dimer mediated by SHLD2 that is important for shieldin assembly.
a Schematic representation of the MAD2L2 protein with residues mutated to abolish dimerization. b Immunoblot of TRF2ts MEFs transduced with indicated shRNAs, complemented with shRNA-resistant expression constructs (EV, empty vector control; WT, full-length wild-type MAD2L2; 1xMut and 3xMut as indicated in a, all with single Flag-tag). HSP90 serves as loading control. c Immunoblot of 293T cells transfected with indicated epitope-tagged constructs followed by Flag immunoprecipitation. V5-SHLD2 is detected with V5-antibody, GFP-SHLD3 with GFP-antibody and Flag-MAD2L2 (Fl-MAD2L2) with MAD2L2-antibody. Asterisk denotes immunoglobulin light-chain. Representative of three independent experiments. d SHLD21-95 induces dimerization of MAD2L2-SHLD3 complex. Coomassie-stained SDS-PAGE gels of SEC-profiles of SHLD3-MAD2L2 complex (WT: light green, 1xMut: dark green) and SHLD3-SHLD21-95-MAD2L2 complex (WT: red, 1xMut: orange). Shift in elution-profile indicates an apparent increase of molecular weight of ~54 to ~90 kDa upon addition of SHLD21-95. Molecular weight of MAD2L2 is 25 kDa, of SHLD3 is 29 kDa and of SHLD21-95 is 11 kDa. e Time course of shieldin assembly between components MAD2L2 and SHLD3 shows that assembly of SHLD3-MAD2L2 complex is slow, but accelerated by MAD2L2 dimerization. Coomassie-stained SDS-PAGE gels show a time course of pulldowns of MBP-SHLD3 (bait) and MAD2L2-variants (prey). The SHLD3-fragment used here contains only the second RBM, which is captured by the seatbelt of MAD2L229. A single-point mutation at R124 (1xMut) hinders MAD2L2 dimerization and subsequently lowers binding kinetics. Triple mutation of residues K44, R124, and A135 (3xMut) in the dimerization interface of MAD2L2 has the same effect as 1xMut on binding kinetics. Inducing dimerization by creating GST-fusion partially rescues the assembly kinetics. Representative of n = 4 (MAD2L2WT/MAD2L21xMut) or n = 2 (MAD2L23xMut/GST-MAD2L21xMut). f Graphical representation of data in e. Red curve represents binding kinetics between MAD2L2WT and SHLD328-83 peptide. Light blue and green curves represent the reduction in binding kinetics of MAD2L21xMut and MAD2L23xMut with SHLD328-83. Dark blue curve represents partial restoration of binding kinetics between MAD2L21xMut and SHLD328-83 induced by dimerization of the GST-tag. Graphs represent mean ± s.e.m, n = 4 for MAD2L2WT/MAD2L21xMut, n = 2 for MAD2L23xMut/GST-MAD2L21xMut. Source data are provided as a Source Data file.

