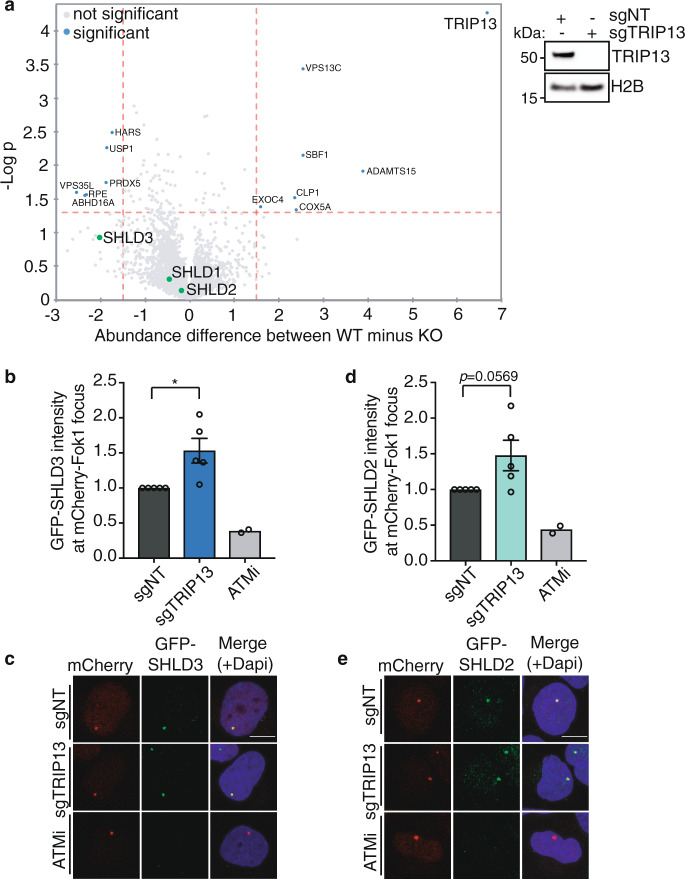
Fig. 6. TRIP13 controls the assembly of SHLD2/3 at DNA breaks.
a Left: Mass-Spectrometry analysis of MAD2L2 interactions upon pulldown of 3xflag-tagged MAD2L2 in 293T cells transduced with sgNT or sgTRIP13. Vulcanoplot represents the abundance difference between the sgNT (WT) and sgTRIP13 (KO) cells and significance over n = 3 independent pulldown experiments. Right: Immunoblot of 293T cells used for mass-spectrometry analysis. b Quantification of the intensity of GFP-tagged SHLD3 signal at mCherry-LakI-Fok1 foci 3 h post activation of the Fok1 nuclease by addition of 4-OHT and shield-1. Graph represent the mean ± s.e.m. of n = 5 (except for ATMi-treated conditions for which n = 2) relative to the sgNT transduced cells. A minimum of 129 cells were analyzed per condition per experiment. Significance was calculated using an unpaired two-tailed t-test, *p = 0.0168. c Representative image of cells quantified in b. d Quantification of the intensity of GFP-tagged SHLD2 as in b. A minimum of 88 cells were analyzed per condition per experiment (two-tailed unpaired t-test, ns p = 0.0569). e Representative image of cells quantified in d. Scale bar, 10 μm. Significance; ns, not significant (p ≥ 0.05), *p < 0.05. Source data are provided as a Source Data file.

