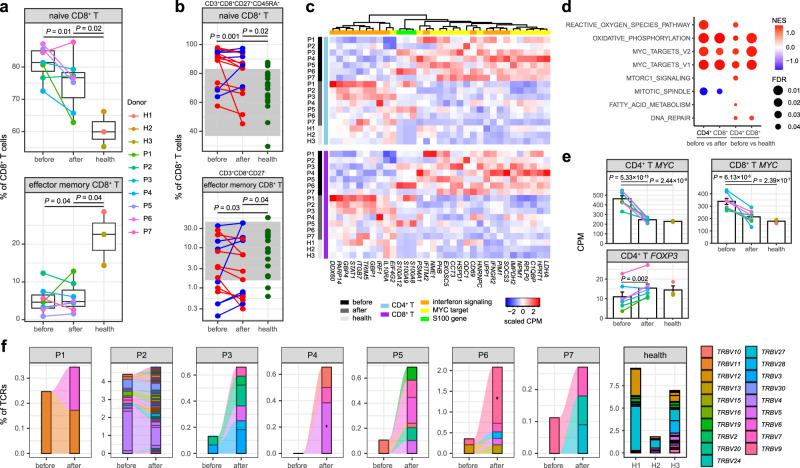
Fig. 5. Characterization of T cells and TCRs.
a Percentage of naive and effector memory CD8+ T cells across conditions recovered by scRNA-seq (KD patients n = 7, healthy controls n = 3). The middle line of the boxplot is the median, the lower and upper hinges correspond to the first and third quartiles, and the whiskers extend from the hinge to the farthest data point within a maximum of 1.5× interquartile range. The samples are colored according to donors. P-values are calculated by using the two-sided t-test. b Percentage of naive (CD3+ CD8+ CD27+ CD45RA+) and effector memory (CD3+ CD8+ CD27−) CD8+ T cells by flow cytometric validation on additional KD patients (n = 16) and healthy controls (n = 20). Patients with a decreased percentage after therapy are colored in red, and patients with an increased percentage after therapy are in blue. Healthy controls are colored in green. The gray areas represent the reference ranges of the panel. P-values between conditions are calculated by using the two-sided t-test. The percentage of effector memory CD8+ T cells is plotted and tested on the log scale. c Heat map of DEGs with functional enrichment shared in CD4+ and CD8+ T cells. Gene expression on the sample level is measured by the counts per million mapped reads (CPM), which is then scaled across samples. d Significant hallmark gene sets identified by GSEA41. The dot size indicates the FDR, and the dot color indicates the normalized enrichment score (NES). A positive NES suggests that the gene set is enriched in upregulated genes before therapy, and a negative NES suggests it is enriched in downregulated genes before therapy. e Expression level of MYC and FOXP3 in T cells across conditions (KD patients n = 7, healthy controls n = 3). The bar plot depicts mean CPM and standard error of the mean. The samples are in the same colors as a. P-values are calculated with DESeq231 (two-sided). f TCR clonotype tracking in each patient. The clonotype composition is represented by stacked bar plots, which are colored according to TRBV families. Only clonotypes with clonal size ≥3 are plotted, and proportion of TCRs in these clonotypes are compared before and after therapy by using the two-sided Fisher’s exact test. Individual clonotypes with FDR < 0.01 are marked with stars. Source data are provided in the Source Data file.

