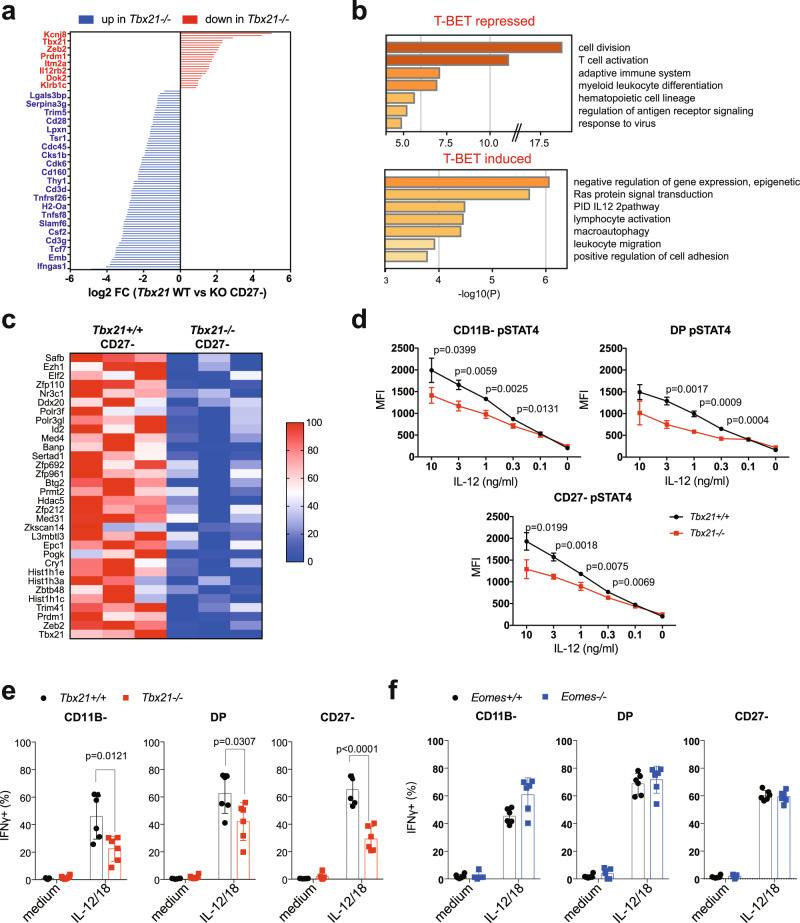
Fig. 7. T-BET-specific role in the repression of pluripotency and cell proliferation.
RNA-seq analysis of sorted Tbx21−/−, Eomes−/− and appropriate control CD11B- and CD27− NK cells (n = 3 per group with three sorts in total). DEGs were selected based on adjusted p < 0.05. a Genes specifically regulated by T-BET in mature CD27− NK cells. Bar graphs show the log2 transformed fold change between controls and T-BET deficient mice, as indicated. A few selected gene names are shown. b Functional annotation of the T-BET-repressed and T-BET-induced genesets using Metascape. Bar graphs show selected terms among the most significant ones. c Transcription factors, histone subunits or histone modifying enzymes whose expression are dependent on T-BET. The heatmap shows the log2 transformed fold change in expression between control and T-BET deficient mature NK cells. d Flow cytometry analysis of STAT4 phosphorylation in WT vs T-BET deficient NK cells of the indicated subset in response to stimulation with IL-12 for 1 h. Graphs show the MFI ± SD. Data are from 3 mice representative of two experiments. e–f Flow cytometry analysis of intracellular IFNγ expression in gated spleen NK cells of the indicated genotype following culture in medium supplemented or not with IL-12 and IL-18. Bar graphs show the mean percentage of IFNγ positive NK cells ± SD. N = 6 mice in 2 experiments. Unpaired t tests (two-tailed) were used for statistical analysis of data presented in this figure.

