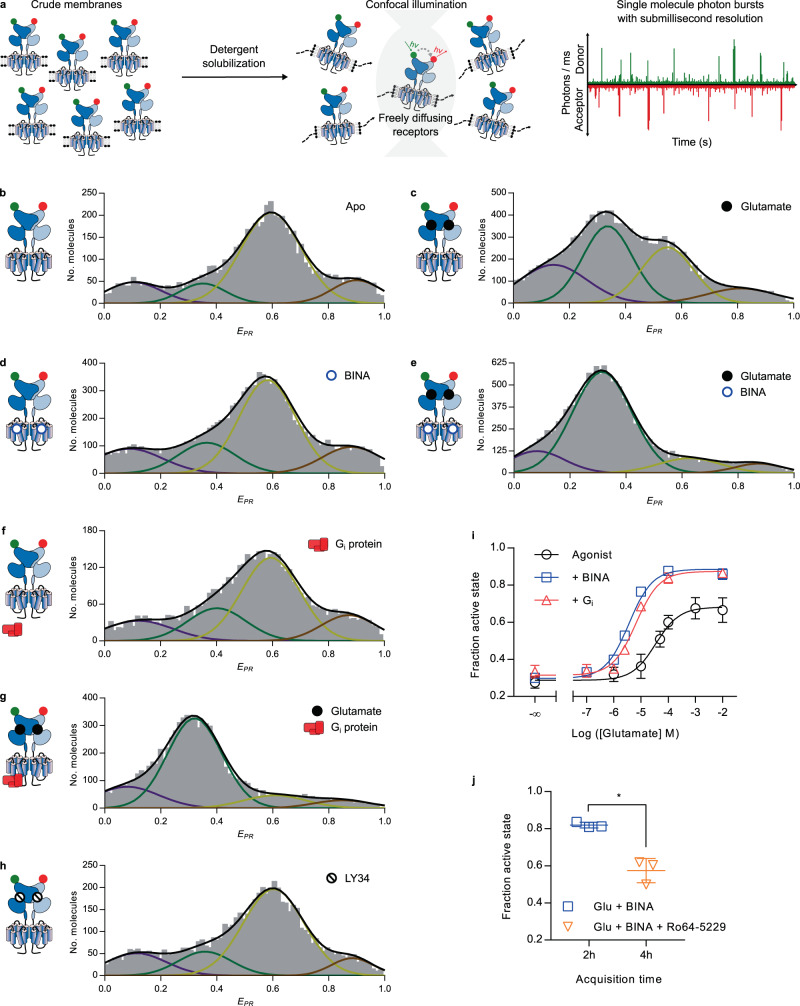
Fig. 3. smFRET reveals the conformational landscape of full-length mGlu2 in LMNG-CHS-GDN micelles.
a SNAP-mGlu2 dimers were labeled with cell-impermeable Cy3B donor and d2 acceptor fluorophores on living HEK-293T cells. Then mGlu2 dimers were detergent-solubilized from crude membrane fractions and smFRET measurements were performed on freely diffusing molecules with confocal illumination. b–h Representative histograms displaying the number of doubly labeled molecules as a function of apparent FRET efficiency (EPR). Distributions were obtained in the absence of ligand (Apo) or in the presence of Glu (10 mM), competitive antagonist LY341495 (1 mM), BINA (10 µM), and G protein (1 µM), as indicated. Colored lines represent Gaussian fitting, black lines correspond to the cumulative fitting (see text). All histograms revealed four major populations at very low FRET (VLF, purple), low FRET (LF, green), high FRET (HF, yellow), and very high FRET (VHF, red). i smFRET analysis of the effect of Glu without (Agonist) or with BINA (10 mM) or Gi (1 µM), as indicated. The fraction of the active state is defined as the fraction of molecules in the LF population over all molecules in the LF+HF populations. j) smFRET analysis of the reversibility of the PAM-induced full ECD activation (500 nM, 2 h) through competition with an excess of the NAM Ro64-5229 (10 µM, 4 h). The statistical difference was determined using a two-sided, paired t test and is given as *p = 0.017. n = 3 independent biological replicates examined over 3 independent experiments. i–j Data were obtained from three biological replicates and are given with mean ± SD. Source data of panels b–j are provided as a source data file.

