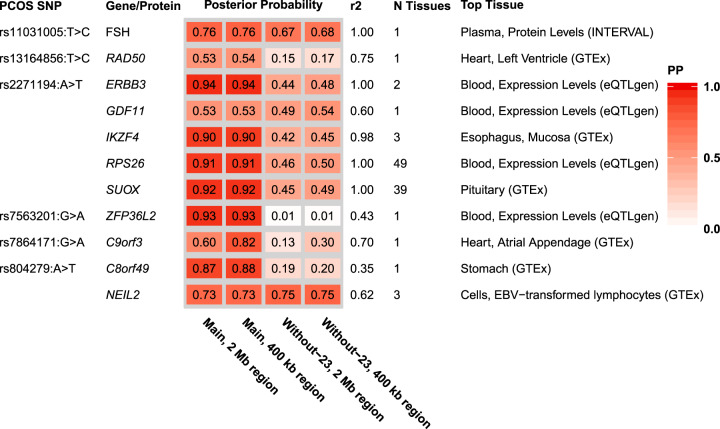
Fig. 2. Posterior probabilities for genes and proteins with any evidence of colocalization.
In the main approach, we used a region size spanning 2 Mb, and 400 kb regions as a sensitivity analysis. In addition to the main PCOS dataset, we also performed colocalization analysis with a PCOS dataset where the 23andMe cohort had been excluded as a sensitivity analysis. r2 is the linkage disequilibrium value between the top SNP in the main PCOS dataset and the top SNP in the tissue expression/protein dataset, using the 2 Mb region size. N tissues are the number of tissues where the colocalization PP > 0.5 in the main analysis. Only the results for the tissue with the highest posterior probability of colocalization in the main analysis are reported here (for full results and power calculations see Supplementary Tables 1–3). Gene-tissue combinations with a posterior probability of colocalization >0.50 were seen as having some evidence in favour of colocalization, whereas the threshold for strong evidence was set at ≥0.75. PCOS polycystic ovary syndrome, PP posterior probability, Without-23 the PCOS dataset where the 23andMe cohort had been excluded.

