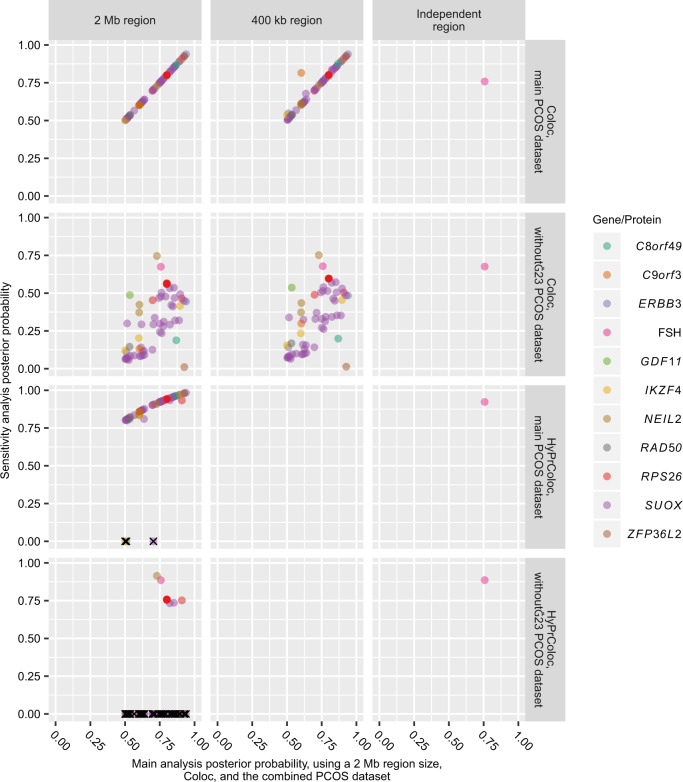
Fig. 4. Plot showing the posterior probabilities as computed in the sensitivity analyses compared to those obtained in the main analysis.
Top left plot is a reference plot with the main results on both axes. Multiple genes on each plot represent different tissues and/or datasets. Method-region-dataset combinations missing on plot were not performed due to either limitations in data availability or recommendations for HyPrColoc settings (see “Materials and methods”). HyPrColoc analyses that are not colocalizing do not have a posterior probability computed; these were manually assigned a posterior probability of 0 and marked with “X” on the plot. Without-23, PCOS dataset where the 23andMe cohort had been excluded.

