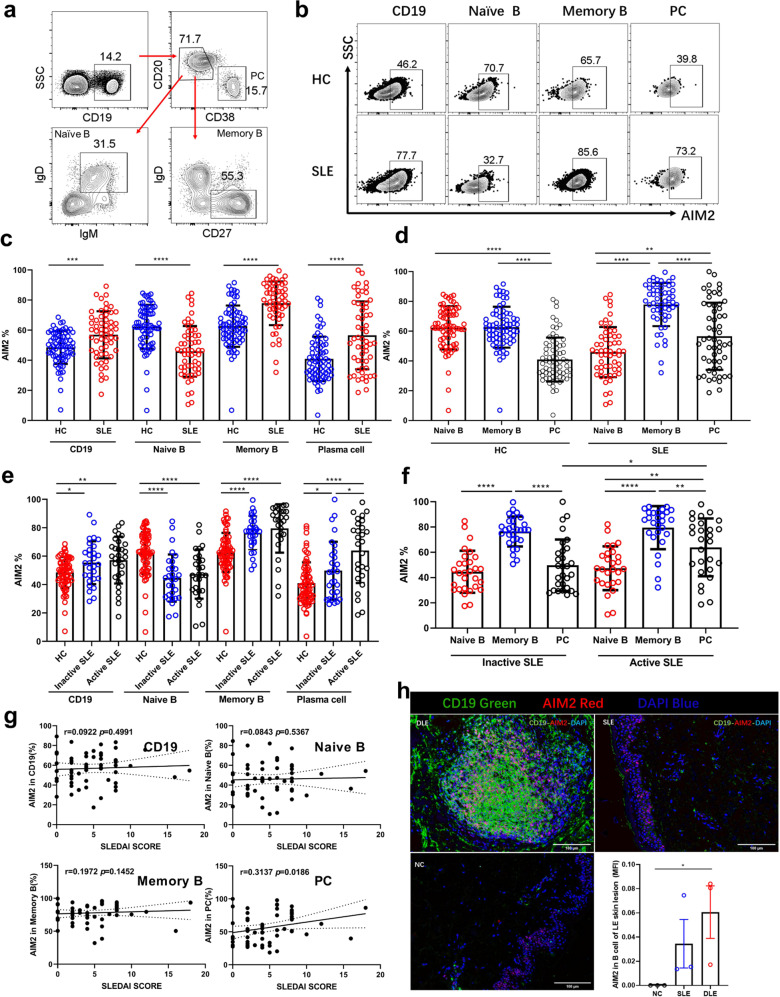
Fig. 1.
The expression of AIM2 in circulating B cells and skin B cells from SLE patients. The expression of AIM2 was detected by flow cytometry and multicolor microscopy. a Representative flow diagram of gating for plasma cells, naive B cells, and memory B cells. b Representative flow diagram of AIM2 expression in plasma cells, naive B cells, and memory B cells from HC subjects (n = 70), inactive SLE patients (n = 29), and active SLE patients (n = 27). c–g Statistical analysis of AIM2+ cells in populations of plasma cells, naive B cells, and memory B cells. h The location and expression levels of AIM2 in normal control (NC), SLE, and DLE skin samples. CD19+ B cells are in green, and AIM2+ cells are in red. Horizontal bars represent the mean ± SEM. *p < 0.05, **p < 0.01, ***p < 0.005, ****p < 0.0001

