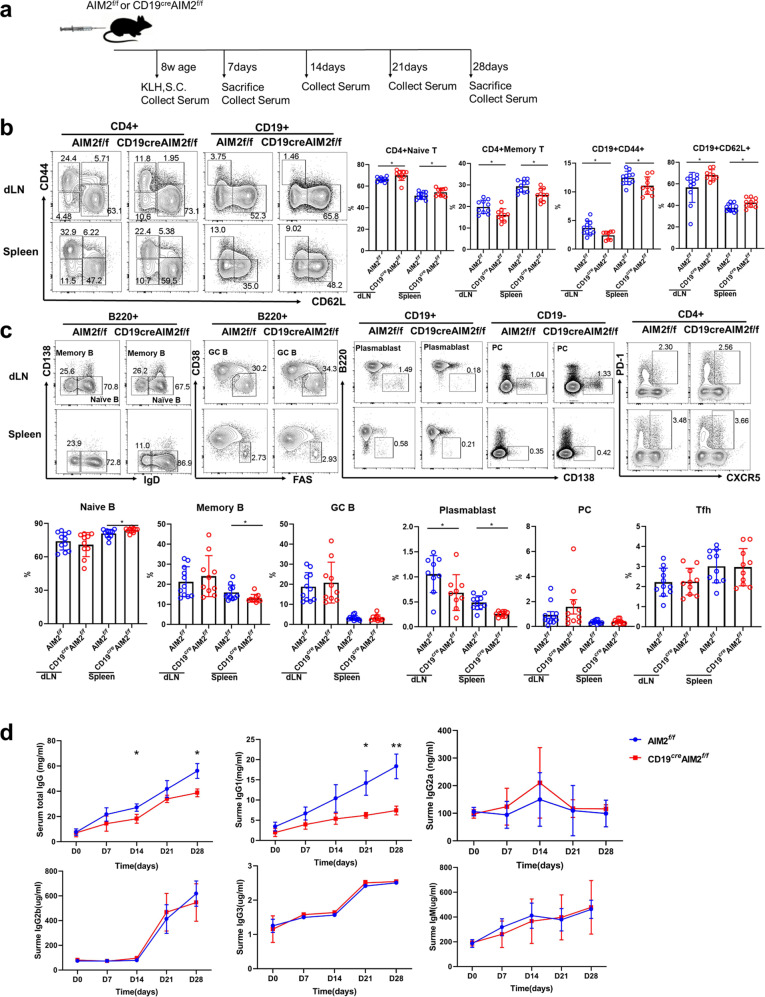
Fig. 3.
The KLH-induced response in CD19creAIM2f/f mice. a A schematic of the KLH-induced response experiments. On day 7 after KLH immunization, cells were collected from the dLNs and spleens of the CD19creAIM2f/f mice and AIM2f/f mice. b Representative flow cytometry diagrams and statistical analysis of the percentages of CD4+ naïve T cells, CD4+ memory T cells, CD19+CD44+ B cells, and CD19+CD62L+ B cells in the dLNs and spleens of the CD19creAIM2f/f mice and AIM2f/f mice. c Representative flow cytometry diagrams and statistical analysis of the percentages of naïve B cells, memory B cells, GC B cells, plasmablast cells, plasma cells, and Tfh cells in the dLNs and spleens of the CD19creAIM2f/f mice and AIM2f/f mice. d The serum levels of total IgG, IgG1, IgG2a, IgG2b, IgG3, and IgM from the KLH-immunized mice on days 0, 7, 14, 21, and 28. Horizontal bars represent the mean ± SEM. *p < 0.05, **p < 0.01

