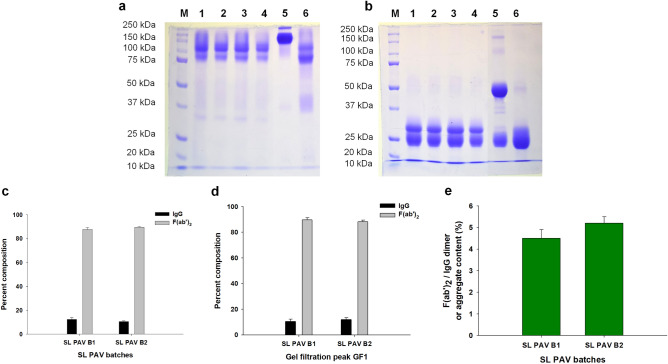
Figure 2.
SDS-PAGE analysis of the two batches of SL PAV and their gel filtration fractions under (a) non-reduced, and (b) reduced conditions. Lanes M, protein molecular markers; lanes 1 and 3 represent PAV of batch B1 and B2, respectively; lanes 2 and 4 represent gel filtration peak GF1 of B1 and B2 of PAV, respectively; lanes 5 and 6 represent purified horse IgG and F(ab′)2 fragment, respectively. Determination of percent composition of IgG and F(ab′)2 by densitometry analysis; (c) two batches of SL PAV and (d) their gel filtration fractions (GF1). (e) Analysis of F(ab′)2 and/or IgG aggregates in the PAVs (B1 and B2) by SDS-PAGE analysis. Values are mean ± SD for triplicate determinations. No significant difference was observed between the two batches of SL PAV (p > 0.05).

