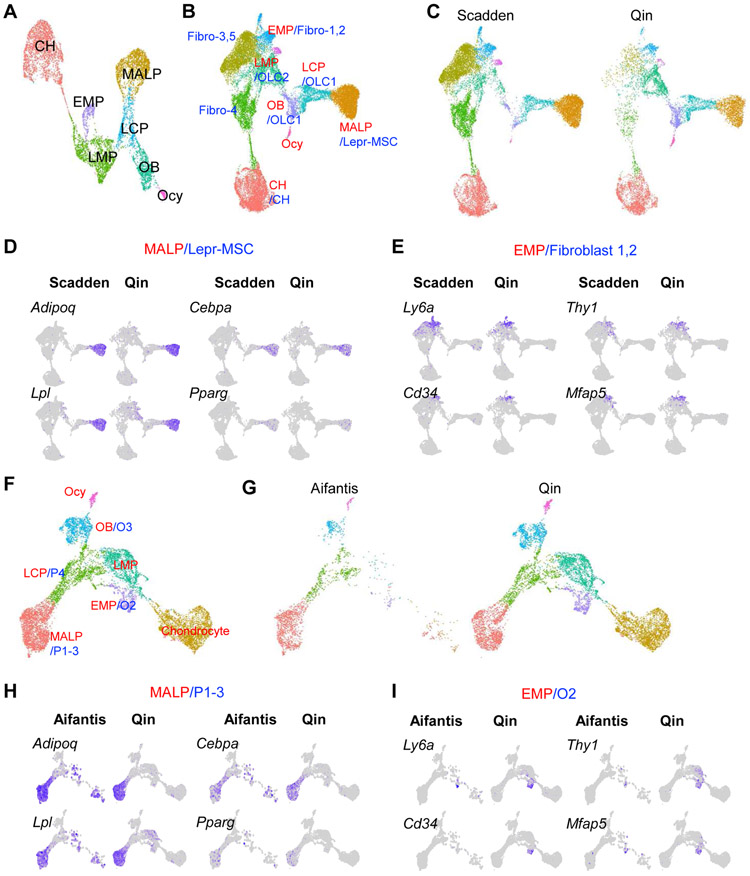
Figure 1. ScRNA-seq datasets of bone marrow mesenchymal lineage cells contain a large MALP subpopulation.
A. UMAP plot of bone marrow mesenchymal lineage cells from Qin group’s 1 month dataset.
B. UMAP plot of integrated dataset containing cells from Qin (GSE145477) and Scadden (GSE128423) scRNA-seq datasets. Newly clustered subpopulations are named by their corresponding cluster names from Qin dataset (red) followed by corresponding cluster names from Scadden dataset (blue). Fibroblast clusters 1,2 (fibro-1,2) from Scadden dataset were previously annotated as MSC-like cells. Fibroblast clusters 3-5 (fibro-3,4,5) from Scadden dataset were previously annotated as tenocyte lineage cells, which are mostly absent in Qin dataset. OLC: osteolineage cell.
C. Split UMAP view of integrated dataset by the original datasets.
D. UMAP plots of MALP/LepR-MSC cluster markers.
E. UMAP plots of EMP/Fibroblast 1 cluster markers.
F. UMAP plot of integrated dataset containing cells from Qin (GSE145477) and Aifantis (GSE108892) scRNA-seq datasets. Newly clustered subpopulations are named by their corresponding cluster names from Qin dataset (red) followed by corresponding cluster names from Aifantis dataset (blue).
G. Split UMAP view of integrated dataset by the original datasets.
H. UMAP plots of MALP/P1-3 cluster markers.
I. UMAP plots of EMP/O2 cluster markers.

