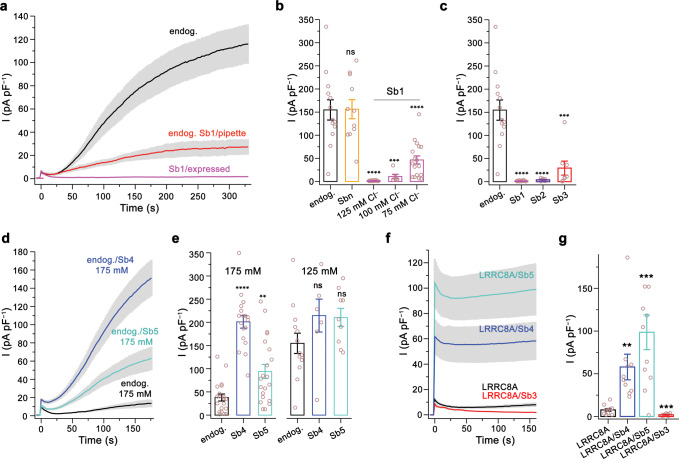
Fig. 2. Functional characterization of sybodies targeting the LRR domains.
a Average current density of HEK293 cells in response to a decrease of the intracellular ionic strength. Currents from WT cells (endog.) with a pipette solution containing 125 mM salt (black, n = 11), additional 1 µM of Sb1 (red, n = 10) or from cells expressing Sb1 (magenta, n = 12). b Currents of cells expressing Sb1 at indicated intracellular ion concentrations (125 mM Cli−, n = 12; 100 mM Cli−, n = 6; 75 mM Cli−, n = 18). Non-transfected cells (endog., n = 13) and cells expressing Sbn (n = 11), both recorded at 125 mM Cli−, are shown for comparison. c Currents (at 125 mM Cli−) from cells expressing different inhibitory sybodies (endog, n = 13; Sb1, n = 12; Sb2, n = 8; Sb3, n = 8). d Average response (at 175 mM Cli−) of HEK293 cells expressing the potentiating sybodies Sb4 (blue, n = 17) and Sb5 (cyan, n = 21) compared to WT (black, n = 20). e Current-densities of cells expressing Sb4 and Sb5 in comparison to WT cells at 175 mM (endog., n = 20; Sb4, n = 17; Sb5, n = 21) and 125 mM Cli−(endog., n = 13; Sb4, n = 7; Sb5, n = 9). f Average response of LRRC8−/−cells expressing mouse LRRC8A (black, n = 11) or LRRC8A and the respective sybodies Sb4 (blue, n = 10), Sb5 (cyan, n = 11) and Sb3 (red, n = 11) at 75 mM Cli−. g Mean current-densities of LRRC8−/−cells expressing mouse LRRC8A (black) and the indicated sybodies (LRRC8A, n = 11; Sb4, n = 10; Sb5, n = 11; Sb3, n = 11). Currents are recorded at 100 mV (a, d, f, g) or 80 mV (b, c, e) by patch-clamp electrophysiology in the whole-cell configuration. b, c, e, g Values of individual measurements are displayed as circles, mean current levels as bars. Asterisks indicate significant deviations from WT (endog.) in a two-sided one sample t-test, ns refers to non-significant differences. (b Sbn p = 0.96, Sb1 125 mM p < 0.0001, Sb1 100 mM p = 0.0004, Sb1 75 mM p < 0.0001, c Sb2 p < 0.0001, Sb3 p = 0.0006, d Sb4 175 mM p < 0.0001, Sb5 175 mM p = 0.0023, Sb4 125 mM p = 0.147, Sb5 125 mM p = 0.087, g Sb4 p = 0.038, Sb5 p = 0.0006, Sb3 p = 0.0009). a–g Data are from independent biological replicates, errors are s.e.m.

