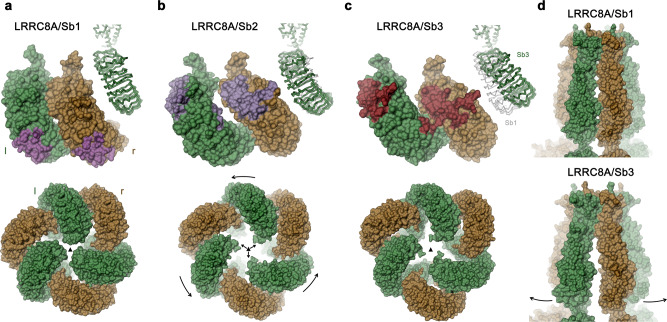
Fig. 6. Conformational changes of LRRC8A in response to inhibitory sybody binding.
a LRRC8A/Sb1 complex, b LRRC8A/Sb2 complex, c LRRC8A/Sb3 complex. a–c Shown are surface representations of domain pairs at the tight interface (top) with contact regions with bound sybodies colored and the hexameric assembly of the domains viewed from the cytoplasm with symmetry axis indicated as triangle (bottom). Insets (top right) display Cα trace of the right subunit of the respective structure, which is superimposed in b and c on the respective structure of the complex with sybody Sb1. d Surface representation of the pore domain of the LRRC8A/Sb1 (top) and the LRRC8A/Sb3 complex (bottom) viewed from within the membrane.

