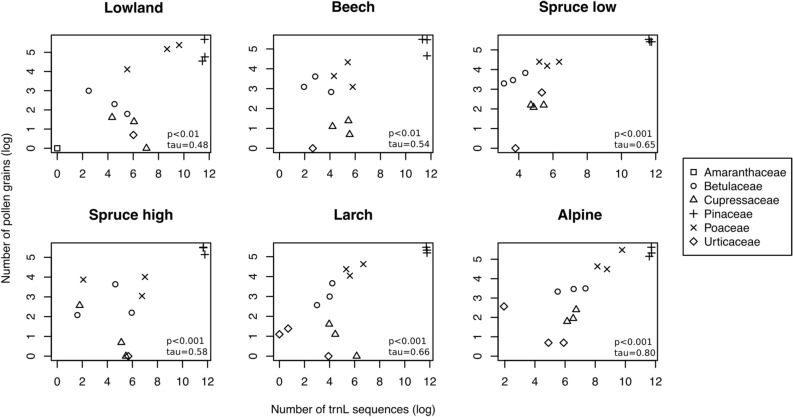
Figure 5.
Log-scaled quantification results as estimated by trnL metabarcoding counts (x-axis) and pollen microscope counts (y-axis). The results are summarized for the top five families identified by metabarcoding by habitat group for the period March–July 2015. P-values and the correlation coefficient from Kendall tau rank correlation tests are provided in the plot of each habitat. The full names of the corresponding habitats are given in Table 1.

