Figure 4.

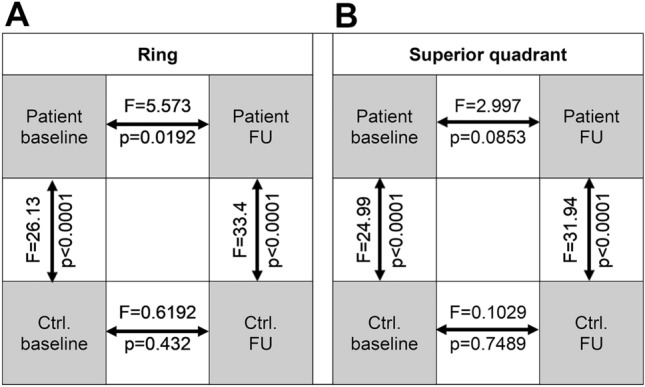
Comparison matrix of flow deficit linear regression slopes for (A) the ring area and (B) the superior ring quadrant. Arrows indicate respective comparisons with p and F values (derived from F tests). Ctrl control, FU follow-up.

Comparison matrix of flow deficit linear regression slopes for (A) the ring area and (B) the superior ring quadrant. Arrows indicate respective comparisons with p and F values (derived from F tests). Ctrl control, FU follow-up.