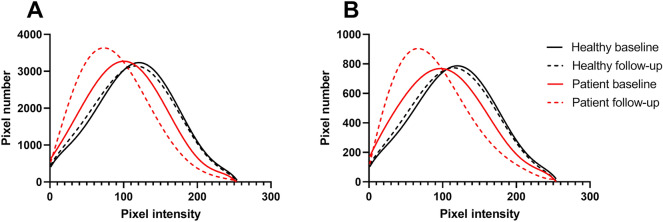
Figure 5.
Plots illustrating the distribution of frequencies of grey level intensities in (A) the ring area and (B) the superior ring quadrant of patients and controls at baseline and 5-year follow-up. Mean pixel intensity distribution in healthy controls (n = 8) was identical at baseline and follow-up. Mean pixel intensity distribution in patients (n = 8) was non-identical at baseline and follow-up and different to patients’ distribution at both time points. Individual data points were fitted by sixth order polynomial nonlinear regression.

