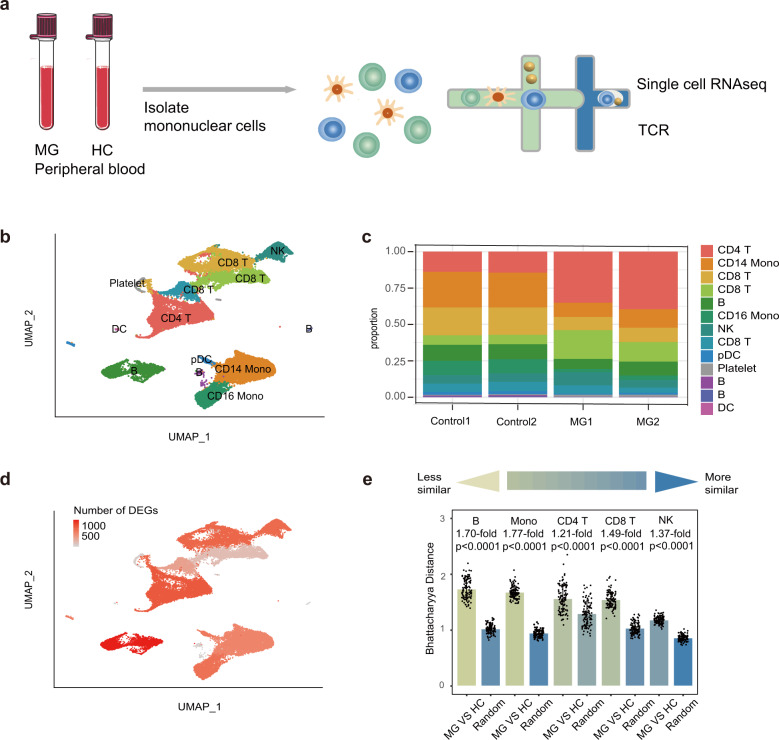
Fig. 1. Assessment of major changes in transcriptional profiles between MG patients and healthy controls.
a Overview of the scRNA-seq experiment: PBMCs were isolated from two healthy controls and two myasthenia gravis patients. Overall, ~39,243 cells were included in the functional analysis. b Uniform manifold approximation and projection (UMAP) representation of scRNA-seq data showing the seven main cell types: CD8+ T cells, CD4+ T cells, B cells, CD14+ monocytes, FCGR3A+ monocytes, NK cells, and DCs. c Cluster abundance across all samples. d Number of DEGs between MG and HC cells within each cluster projected onto the UMAP. DEG: |log fold change| > 0.5; P-value < 0.05 was calculated using DESeq2. e Quantification of differences between major immune cells between MG patients and HCs. Each dot represents a sub-sample of 500 cells from the principal component analysis space for MG patients and HCs. For the random groups, we sampled 500 cells of sample type. The height of the bar represents the mean values of the subsamples. All comparisons were significant due to 100 replicates of testing, while the mean fold change varied from 1.77-fold (monocytes) to 1.21-fold (CD4+ T cells). P values are from a Wilcoxon rank-sum test comparing the MG vs HC groups to the random selection for each type of major immune cell.

