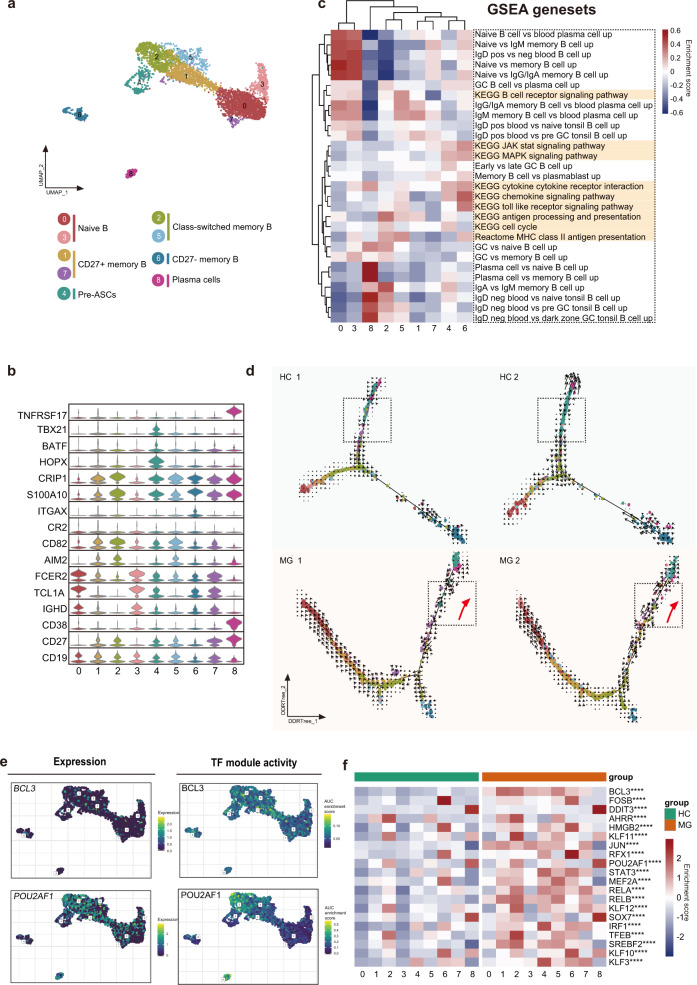
Fig. 2. Assessment of changes in B cells in transcriptional profiles between MG patients and healthy controls.
a UMAP plot displaying 4133 B cells from two MG patients and two HCs separated into 9 subtypes. b Violin plots showing key gene markers across B cell subsets. c Gene set enrichment revealed differences in pathway activities and cell identity of naive, memory, switched B cells, and plasma B cells. d B cells were sorted using the DDRTree algorithm and projected onto the different cell states using the color in a. Transcriptional activity was estimated by measuring the ratio between unspliced and spliced mRNAs. The length of the arrow represents the transcriptional activity. e UMAP plots showing the expression of BCL3 and POU2AF1 genes in B cells (top) and the AUC of the estimated regulon activity of the corresponding TFs, predicting the degree of expression regulation of their target genes (bottom). f Heatmap of the AUC scores of expression regulation by transcription factors (regulon activity), as estimated using SCENIC, followed by comparisons between two groups using the t-test. The twenty transcription factors with the highest upregulated expression in MG are shown.

