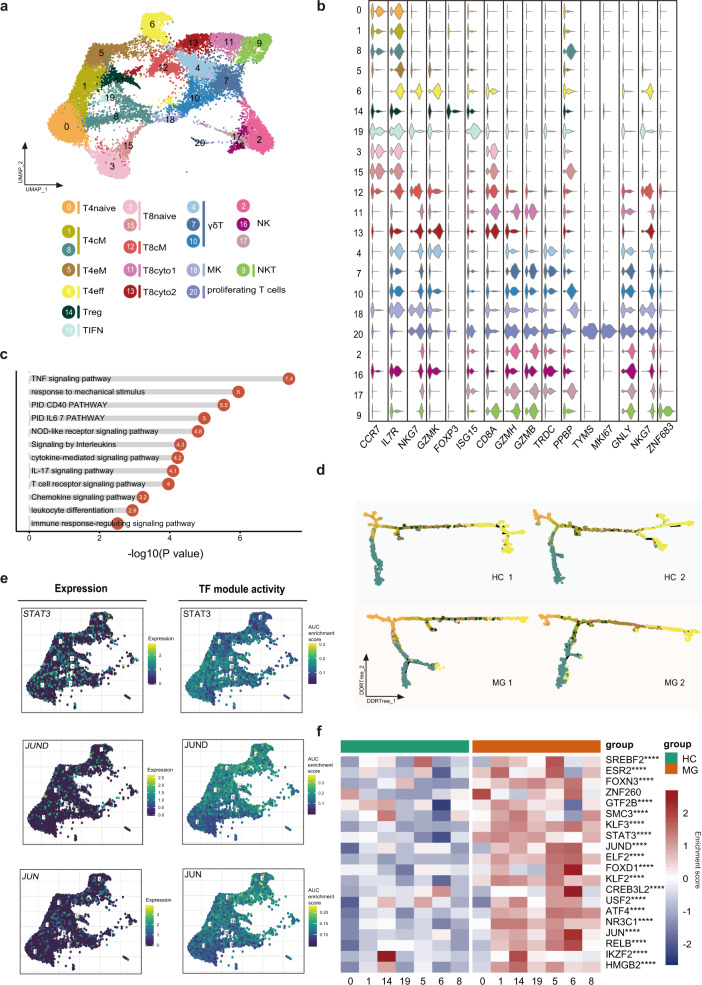
Fig. 4. Assessment of changes in T cells in transcriptional profiles between MG patients and healthy controls.
a UMAP plot displaying T cells and NK cells from two MG patients and two HCs separated into 21 subtypes. b Violin plots showing key gene markers across T cells and NK cells. c Enrichment analysis of DEGs in CD4+ T cells between MG patients and HCs (selected among upregulated pathways in MG patients, P value < 0.05). d CD4+ T cells were sorted using the DDRTree algorithm and projected onto the different cell states using the color in a. e UMAP plots showing expression of the STAT3, JUND, and JUN genes in CD4+ T cells (top) and the AUC of the estimated regulon activity of the corresponding TFs, predicting the degree of expression regulation of their target genes (bottom). f Heatmap of the AUC scores of expression regulation by transcription factors (regulon activity) as estimated using SCENIC, followed by comparisons between two groups using t-test. The top 20 transcription factors with the highest upregulated expression in MG are shown.

