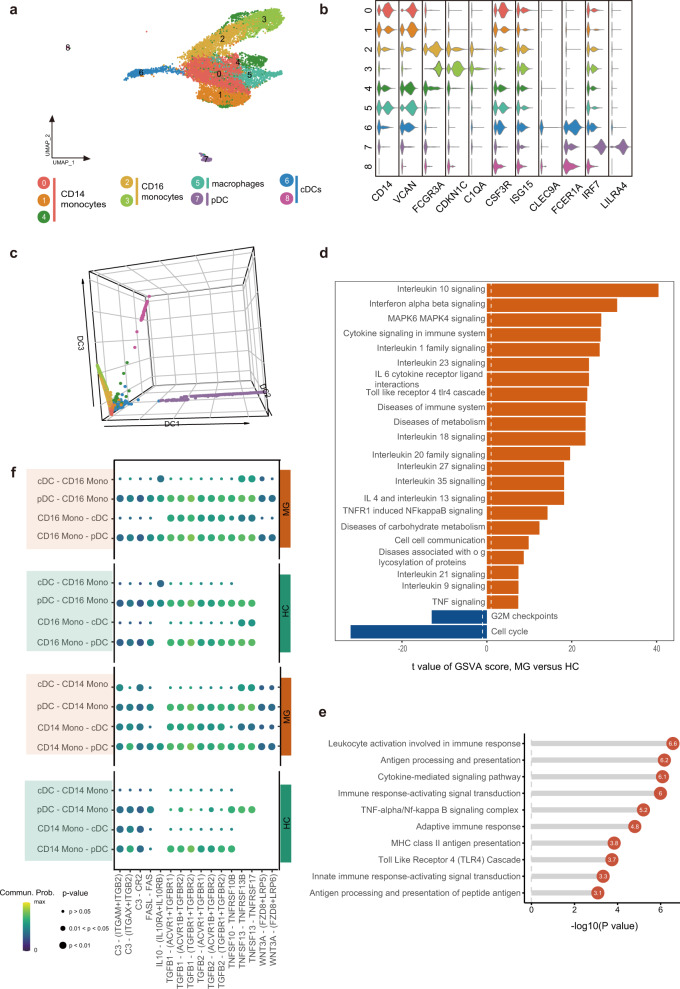
Fig. 5. Assessment of changes in myeloid cells in transcriptional profiles between MG patients and healthy controls.
a UMAP plot displaying myeloid cells from two MG patients and two HCs separated into 9 subtypes. b Violin plots showing key gene markers across myeloid cells. c 3D diffusion map displaying the developmental trajectory of myeloid cells. The result shows the possible activation paths of macrophages/cDCs. Cells are colored by their derived clusters. pDCs, plasmacytoid dendritic cells; cDCs, conventional DCs. d Enrichment analysis of DEGs in dendritic cells between MG patients and HCs (selected among upregulated pathways in MG patients, P value < 0.05). e GSVA analysis of CD14+ monocytes between MG patients and HCs. f Dot plot of selected significant paracrine receptor-ligand interactions between CD14+/CD16+ monocytes and cDCs discovered using Cellchat. Commun.Prob., communication probability.

