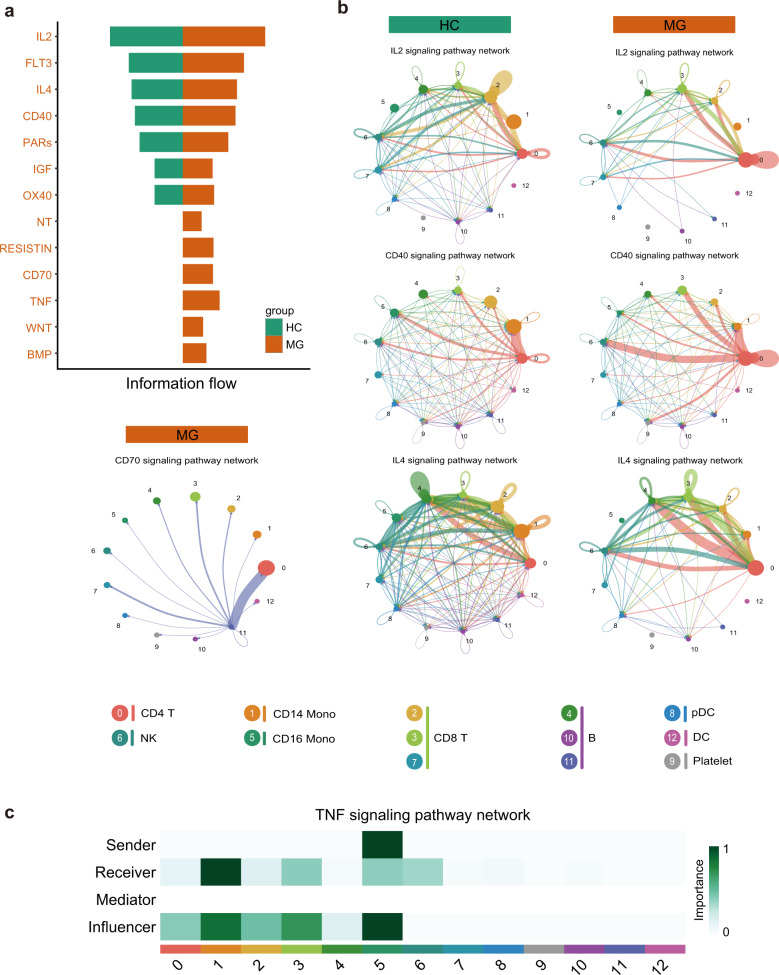
Fig. 6. Evaluation of expression of genes for receptors and ligands, and cell-cell communication.
a The significant signaling pathways were ranked based on their differences in overall information flow within the inferred networks between HCs and myasthenia gravis patients. We show the more enriched signaling pathways colored in orange in myasthenia gravis. b Circos plot showing the inferred intercellular communication network across major cell types using the color of b for HCs and MG patients. c Heatmap showing the relative importance of each cell group based on the computed four network centrality measures of the TNF signaling pathway. Information flow refers to the overall communication probability.

