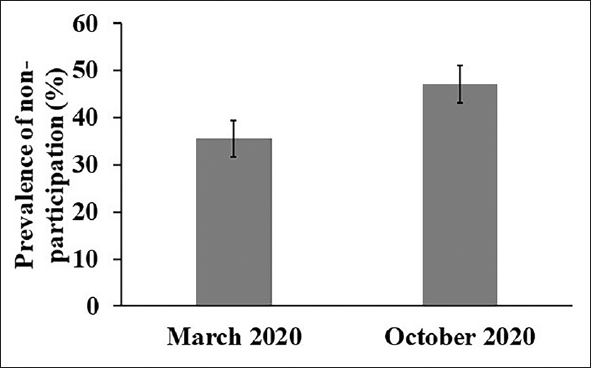
Figure 1.

Changes in prevalence of non-social participation in March and October 2020
The error bar indicates 95% confidence intervals (CIs). The values were imputed by the multiple imputation approach. The prevalence of non-participation was 35.5% (95% CI = 32.7–39.4) in March and 47.1% (95%CI = 43.1–51.1) in October 2020.
