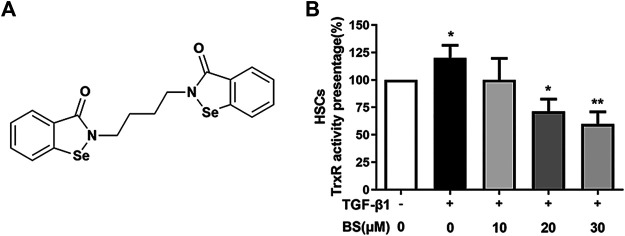
FIGURE 2.
BS decreased TrxR activity in activated HSCs. (A) Chemical structure of BS. (B) The TrxR activity was assessed in activated HSCs, and the cells were induced by 5 ng/ml TGF-β1. Data were shown as mean ± SD, n ≥ 3 and analyzed with the one-way ANOVA. *p < 0.05, TGF-β1 positive, and 0 μM BS group versus TGF-β1 negative, 0 μM BS group. *p < 0.05, **p < 0.01, TGF-β1 positive, 10–30 μM BS groups versus TGF-β1 positive, 0 μM BS group.

