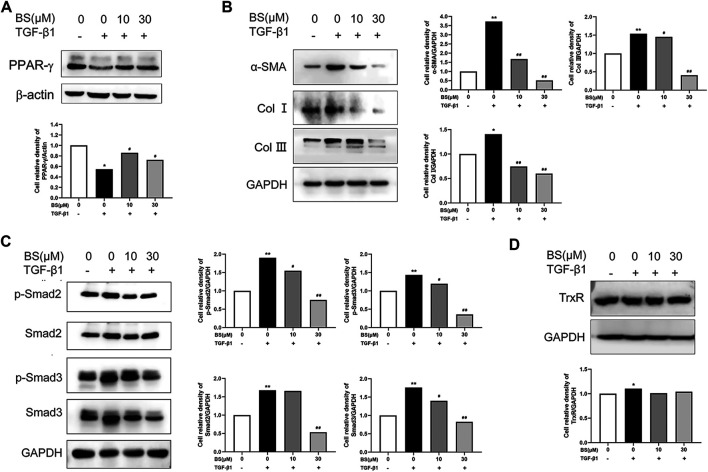
FIGURE 4.
BS inhibited the expressions of fibrosis-related proteins in vitro. HSCs were incubated with or without BS and 5 ng/ml TGF-β1. (A) The protein levels of PPAR-γ as measured by western blot analysis. (B) The protein expressions of α-SMA, Col Ⅰ, and Col III as measured by Western blot analysis. (C) The protein expressions of p-Smad2, Smad2, p-Smad3, and Smad3 as measured by Western blot analysis. (D) The protein expression of TrxR as measured by Western blot analysis. Data were shown as mean ± SD, n ≥ 3 and analyzed with the one-way ANOVA. *p < 0.05, **p < 0.01, TGF-β1 positive, 0 μM BS groups versus TGF-β1 negative, 0 μM BS groups. # p < 0.05, ## p < 0.01, TGF-β1 positive, 10–30 μM BS groups versus TGF-β1 positive, 0 μM BS groups.

