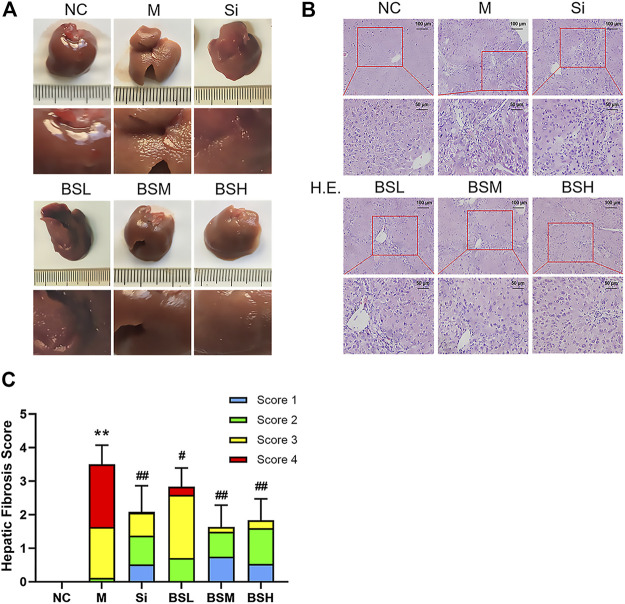
FIGURE 7.
BS improved the pathological characteristics in mouse liver fibrosis models. (A) The pathological changes of each group at the end of the experiment. (B) Representative liver sections of H&E staining; scale bars = 100 μm, 50 μm as indicated. (C) Hepatic fibrosis scores were counted and compared. Data were shown as mean ± SD, n ≥ 3 and analyzed with the one-way ANOVA. **p < 0.01 in the model group versus the control group. # p < 0.05, ## p < 0.01, Si, BSL, BSM, and BSH groups versus the model group.

