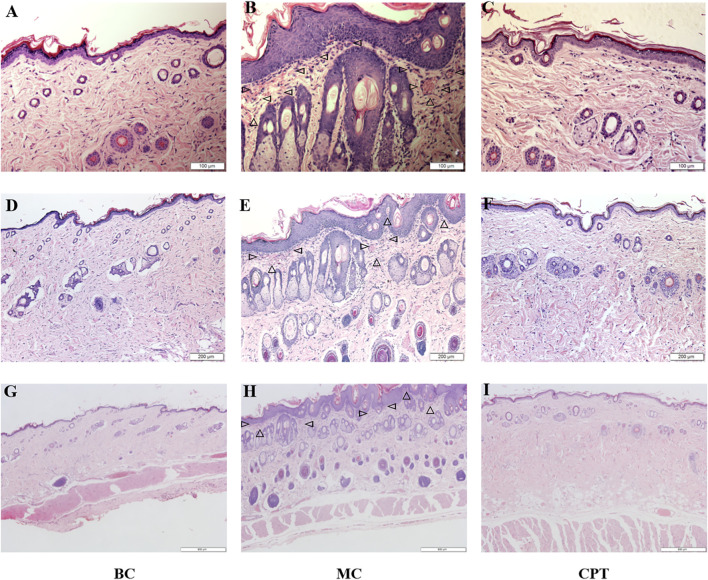
FIGURE 1.
The skin tissues of CPT treatment in acne (HE, magnification ×200, ×100 and ×40) (A), (B) and (C): magnification ×200 (100 μm) (D) (E) and (F): magnification ×100 (200 μm) (G), (H) and (I): magnification ×40 (500 μm) (A), (D) and (G): BC (blank control) group; (B), (E) and (H): MC (model) group; (C), (F) and (I): CPT (treatment) group; the triangles in MC group represent neutrophilic inflammatory cell infiltration.

