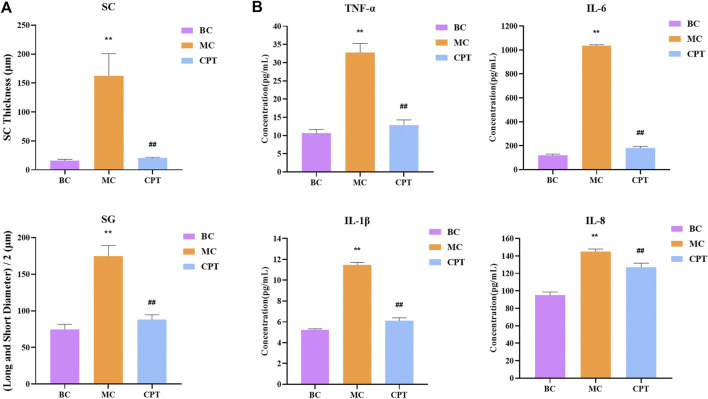
FIGURE 2.
(A) Bar graph of stratum corneum (SC) thickness and half of long diameter and short diameter of sebaceous glands (SG); original magnification, ×200 (B) Cytokine levels in serum of IL-6, IL-8, TNF-α and IL-1β in the BC, MC and CPT groups. **, p < 0.01, compared with the BC group; ##, p < 0.01, compared with the CPT group.

